. 2014 Jul;35(7):3446-64.
doi: 10.1002/hbm.22414. Epub 2013 Nov 12.

Abnormal salience network in normal aging and in amnestic mild cognitive impairment and Alzheimer's disease

Affiliations

Abnormal salience network in normal aging and in amnestic mild cognitive impairment and Alzheimer's disease

Xiaoxi He et al. Hum Brain Mapp. 2014 Jul.

Abstract

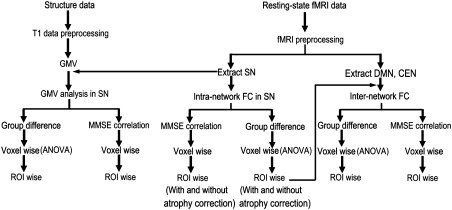
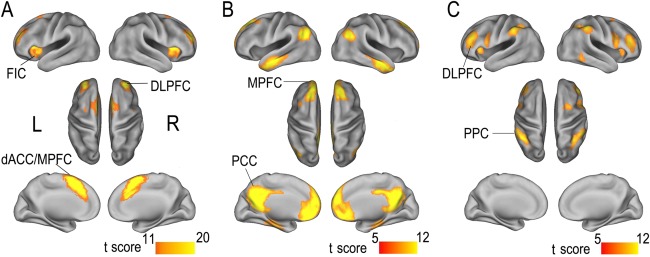
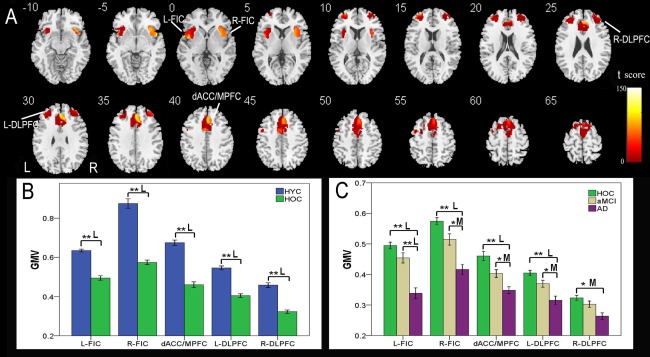
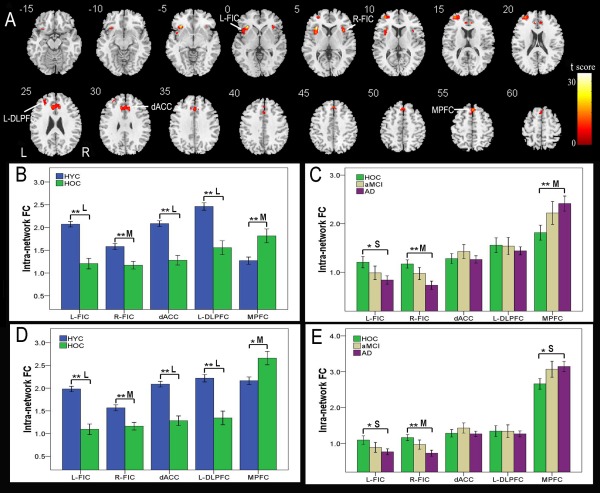
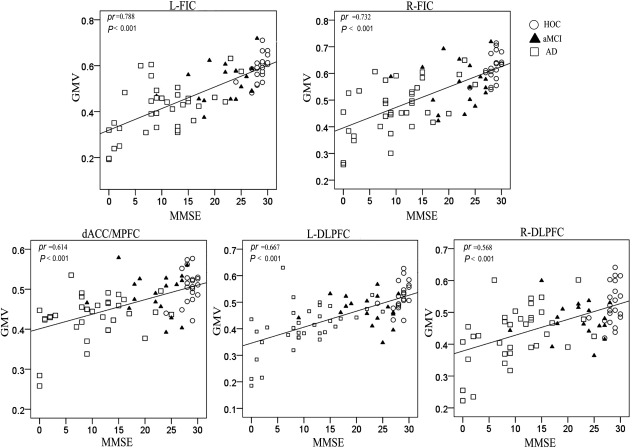
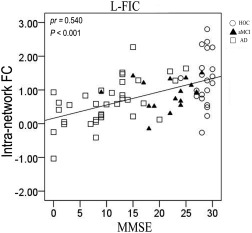
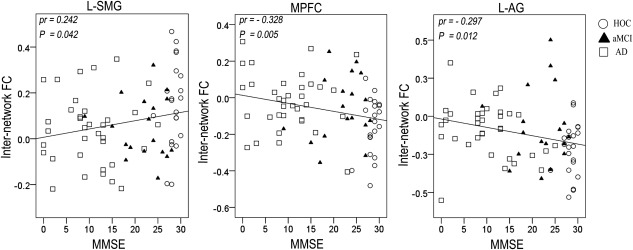
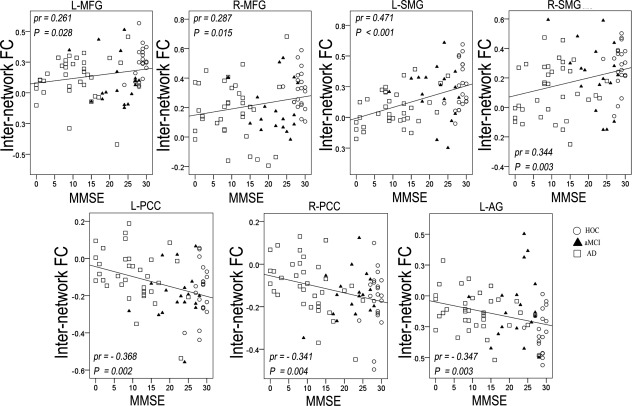
The salience network (SN) serves to identify salient stimuli and to switch between the central executive network (CEN) and the default-mode network (DMN), both of which are impaired in Alzheimer's disease (AD)/amnestic mild cognitive impairment (aMCI). We hypothesized that both the structural and functional organization of the SN and functional interactions between the SN and CEN/DMN are altered in normal aging and in AD/aMCI. Gray matter volume (GMV) and resting-state functional connectivity (FC) were analyzed from healthy younger (HYC) to older controls (HOC) and from HOC to aMCI and AD patients. All the SN components showed significant differences in the GMV, intranetwork FC, and internetwork FC between the HYC and HOC. Most of the SN components showed differences in the GMV between the HOC and AD and between the aMCI and AD. Compared with the HOC, AD patients exhibited significant differences in intra- and internetwork FCs of the SN, whereas aMCI patients demonstrated differences in internetwork FC of the SN. Most of the GMVs and internetwork FCs of the SN and part of the intranetwork FC of the SN were correlated with cognitive differences in older subjects. Our findings suggested that structural and functional impairments of the SN may occur as early as in normal aging and that functional disconnection between the SN and CEN/ DMN may also be associated with both normal aging and disease progression.

Keywords: Alzheimer's disease; functional connectivity; gray matter volume; normal aging; salience network.


Figures

Figure 1
Figure 1
A schematic summary of the study design. Abbreviations: CEN, central executive network; DMN, default‐mode network; FC, functional connectivity; GMV, gray matter volume; MMSE, Mini‐Mental State Examination; ROI, region of interest; SN, salience network.
Figure 2
Figure 2
Spatial maps of the SN (A), DMN (B), and CEN (C). The SN is identified using independent component analysis, whereas the CEN and DMN are identified using ROI‐based functional connectivity analysis. Data are displayed on the lateral and medial surfaces of the left and right hemispheres of the surface map. Abbreviations: CEN, central executive network; dACC/MPFC, dorsal anterior cingulate cortex/medial prefrontal cortex; DLPFC, dorsolateral prefrontal cortex; DMN, default‐mode network; FIC, frontoinsular cortex; L, left; MPFC, medial prefrontal cortex; PCC, posterior cingulate cortex; PPC, posterior parietal cortex; R, right; ROI, region of interest; SN, salience network. [Color figure can be viewed in the online issue, which is available at http://wileyonlinelibrary.com.]
Figure 3
Figure 3
GMV differences in the SN across groups. VBM analysis shows brain regions within the SN with GMV differences (P < 0.01, FDR corrected) across the four groups (A). Each ROI with the most statistical significance in the voxel‐based analyses were then extracted. ROI analysis shows GMV differences in brain regions of the SN between the HYC and HOC (B) and among the HOC, aMCI, and AD (C). The x‐axis represents the ROIs and the y‐axis represents the GMV of each ROI. Error bars indicate the standard error of the mean. *P < 0.05, uncorrected; **P < 0.05, Bonferroni corrected. “S,” “M,” and “L” represent small, medium, and large effect sizes, respectively. Abbreviations: AD, Alzheimer's disease; aMCI, amnestic mild cognitive impairment; dACC/MPFC, dorsal anterior cingulate cortex/medial prefrontal cortex; DLPFC, dorsolateral prefrontal cortex; FDR, false discovery rate; FIC, frontoinsular cortex; GMV, gray matter volume; HYC, healthy younger control; HOC, healthy older control; L, left; R, right; ROI, region of interest; SN, salience network. [Color figure can be viewed in the online issue, which is available at http://wileyonlinelibrary.com.]
Figure 4
Figure 4
Intranetwork FC differences in the SN across groups. Voxel‐based analysis shows brain regions of the SN with intranetwork FC differences (P < 0.01, FDR corrected) across the four groups (A). Each ROI with the most statistical significance in the voxel‐based analyses were then extracted. ROI analysis shows intranetwork FC differences in brain regions of the SN between the HYC and HOC (B) and among the HOC, aMCI, and AD (C). To exclude the effect of GMV decrease on the intranetwork FC, we repeated the ROI‐based intranetwork FC comparisons using the GMV of each ROI as a covariate of no interest (D, E). The x‐axis represents the ROIs and the y‐axis represents the intranetwork FC of each ROI. Error bars indicate the standard error of the mean. *P < 0.05, uncorrected; **P < 0.05, Bonferroni corrected. “S,” “M,” and “L” represent small, medium, and large effect sizes, respectively. Abbreviations: AD, Alzheimer's disease; aMCI, amnestic mild cognitive impairment; dACC, dorsal anterior cingulate cortex; DLPFC, dorsolateral prefrontal cortex; FC, functional connectivity; FDR, false discovery rate; FIC, frontoinsular cortex; HOC, healthy older control; HYC, healthy younger control; L, left; MPFC, medial prefrontal cortex; R, right; ROI, region of interest; SN, salience network. [Color figure can be viewed in the online issue, which is available at http://wileyonlinelibrary.com.]
Figure 5
Figure 5
Overlap between brain regions in the SN with GMV differences and those with intranetwork FC differences. Red indicates GMV differences and yellow represents intranetwork FC differences. Abbreviations: FC, functional connectivity; GMV, gray matter volume; L, left; R, right; SN, salience network. [Color figure can be viewed in the online issue, which is available at http://wileyonlinelibrary.com.]
Figure 6
Figure 6
Internetwork FC differences of the left FIC across groups. Voxel‐based analysis shows brain regions of the CEN (A) and DMN (B) that have internetwork FC differences (P < 0.05, FWE corrected) with the left FIC across the four groups. Each ROI with the most statistical significance in the voxel‐based analyses were then extracted. ROI analysis shows brain regions of the CEN and DMN between the HYC and HOC (C) and among the HOC, aMCI, and AD (D) that have internetwork FC differences with the left FIC across the four groups. The x‐axis represents the ROIs and the y‐axis represents the internetwork FC of each ROI. Error bars indicate the standard error of the mean. *P < 0.05, uncorrected; **P < 0.05, Bonferroni corrected. “S,” “M,” and “L” represent small, medium, and large effect sizes, respectively. Abbreviations: AD, Alzheimer's disease; AG, angular gyrus; aMCI, amnestic mild cognitive impairment; CEN, central executive network; dACC, dorsal anterior cingulate cortex; DLPFC, dorsolateral prefrontal cortex; DMN, default‐mode network; FC, functional connectivity; FIC, frontoinsular cortex; FWE, family‐wise error; HOC, healthy older control; HYC, healthy younger control; IFG, inferior frontal gyrus; L, left; MFG, middle frontal gyrus; MPFC, medial prefrontal cortex; PCC, posterior cingulate cortex; R, right; ROI, region of interest; SMG, supramarginal gyrus; SN, salience network. [Color figure can be viewed in the online issue, which is available at http://wileyonlinelibrary.com.]
Figure 7
Figure 7
Internetwork FC differences of the right FIC across groups. Voxel‐based analysis shows brain regions of the CEN (A) and DMN (B) that have internetwork FC differences (P < 0.05, FWE corrected) with the right FIC across the four groups. Each ROI with the most statistical significance in the voxel‐based analyses were then extracted. ROI analysis shows brain regions of the CEN and DMN between the HYC and HOC (C) and among the HOC, aMCI, and AD (D) that have internetwork FC differences with the right FIC across the four groups. The x‐axis represents the ROIs, and the y‐axis represents the internetwork FC of each ROI. Error bars indicate the standard error of the mean. *P < 0.05, uncorrected; **P < 0.05, Bonferroni corrected. “S,” “M,” and “L” represent small, medium, and large effect sizes, respectively. Abbreviations: AD, Alzheimer's disease; AG, angular gyrus; aMCI, amnestic mild cognitive impairment; CEN, central executive network; dACC, dorsal anterior cingulate cortex; DLPFC, dorsolateral prefrontal cortex; DMN, default‐mode network; FC, functional connectivity; FIC, frontoinsular cortex; FWE, family‐wise error; HOC, healthy older control; HYC, healthy younger control; IFG, inferior frontal gyrus; L, left; MFG, middle frontal gyrus; MPFC, medial prefrontal cortex; PCC, posterior cingulate cortex; R, right; ROI, region of interest; SMG, supramarginal gyrus; SN, salience network. [Color figure can be viewed in the online issue, which is available at http://wileyonlinelibrary.com.]
Figure 8
Figure 8
Brain regions of the SN where the GMV is positively correlated with the MMSE scores. Abbreviations: GMV, gray matter volume; L, left; MMSE, Mini‐Mental State Examination; R, right; SN, salience network. [Color figure can be viewed in the online issue, which is available at http://wileyonlinelibrary.com.]
Figure 9
Figure 9
Scatter plots of the GMVs of the SN regions versus MMSE scores. Abbreviations: AD, Alzheimer's disease; aMCI, amnestic mild cognitive impairment; dACC/MPFC, dorsal anterior cingulate cortex/medial prefrontal cortex; DLPFC, dorsolateral prefrontal cortex; FIC, frontoinsular cortex; GMV, gray matter volume; HOC, healthy older control; L, left; MMSE, Mini‐Mental State Examination; pr, partial correlation coefficients; R, right; SN, salience network.
Figure 10
Figure 10
Brain regions of the SN whose intranetwork FCs are positively correlated with the MMSE scores. Abbreviations: FC, functional connectivity; L, left; MMSE, Mini‐Mental State Examination; R, right; SN, salience network. [Color figure can be viewed in the online issue, which is available at http://wileyonlinelibrary.com.]
Figure 11
Figure 11
Scatter plots of the intranetwork FCs of the SN regions versus MMSE scores. Abbreviations: AD, Alzheimer's disease; aMCI, amnestic mild cognitive impairment; FC, functional connectivity; HOC, healthy older control; L‐FIC, left frontoinsular cortex; MMSE, Mini‐Mental State Examination; pr, partial correlation coefficients.
Figure 12
Figure 12
Scatter plots of internetwork FCs of the left FIC versus MMSE scores. Abbreviations: AD, Alzheimer's disease; aMCI, amnestic mild cognitive impairment; FC, functional connectivity; FIC, frontoinsular cortex; HOC, healthy older control; L‐AG, left angular gyrus; L‐PCC, left posterior cingulate cortex; MMSE, Mini‐Mental State Examination; MPFC, medial prefrontal cortex; pr, partial correlation coefficients.
Figure 13
Figure 13
Scatter plots of internetwork FCs of the right FIC versus MMSE scores. Abbreviations: AD, Alzheimer's disease; aMCI, amnestic mild cognitive impairment; FC, functional connectivity; FIC, frontoinsular cortex; HOC, healthy older control; L‐AG, left angular gyrus; L‐MFG, left middle frontal gyrus; L‐PCC, left posterior cingulate cortex; L‐SMG, left supramarginal gyrus; MMSE, Mini‐Mental State Examination; MPFC, medial prefrontal cortex; pr, partial correlation coefficients; R‐PCC, right posterior cingulate cortex; R‐SMG, right supramarginal gyrus.

Similar articles

Cited by

References

    1. Agosta F, Pievani M, Geroldi C, Copetti M, Frisoni GB, Filippi M (2011): Resting state fMRI in Alzheimer's disease: Beyond the default mode network. Neurobiol Aging 33:1564–1578. - PubMed
    1. Allman JM, Watson KK, Tetreault NA, Hakeem AY (2005): Intuition and autism: A possible role for Von Economo neurons. Trends Cogn Sci 9:367–373. - PubMed
    1. Andrews‐Hanna JR, Snyder AZ, Vincent JL, Lustig C, Head D, Raichle ME Buckner RL (2007): Disruption of large‐scale brain systems in advanced aging. Neuron 56:924–935. - PMC - PubMed
    1. Benoit M, Dygai I, Migneco O, Robert PH, Bertogliati C, Darcourt J, Benoliel J, Aubin‐Brunet V, Pringuey D (1999): Behavioral and psychological symptoms in Alzheimer's disease. Relation between apathy and regional cerebral perfusion. Dement Geriatr Cogn Disord 10:511–517. - PubMed
    1. Binnewijzend MA, Schoonheim MM, Sanz‐Arigita E, Wink AM, van der Flier WM, Tolboom N, Adriaanse SM, Damoiseaux JS, Scheltens P, van Berckel BN, Barkhof F (2011): Resting‐state fMRI changes in Alzheimer's disease and mild cognitive impairment. Neurobiol Aging 33:2018–2028. - PubMed

Publication types