

The Effect of 3D Visual Simulator on Children's Visual Acuity - A Pilot Study Comparing Two Different Modalities
- PMID: 24222810
- PMCID: PMC3821097
- DOI: 10.2174/1874364101307010069
The Effect of 3D Visual Simulator on Children's Visual Acuity - A Pilot Study Comparing Two Different Modalities
Abstract
Purpose: To evaluate the efficacy of two non-surgical interventions of vision improvement in children.
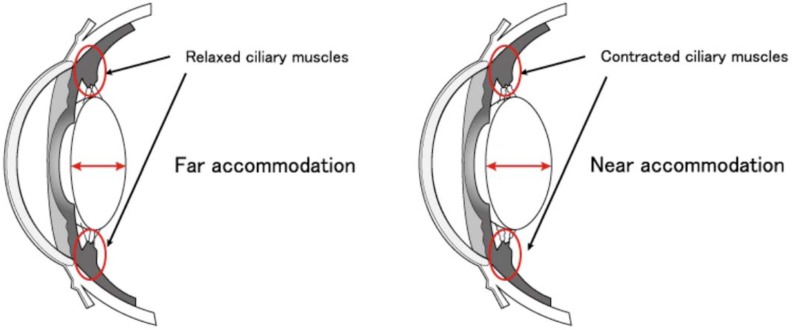
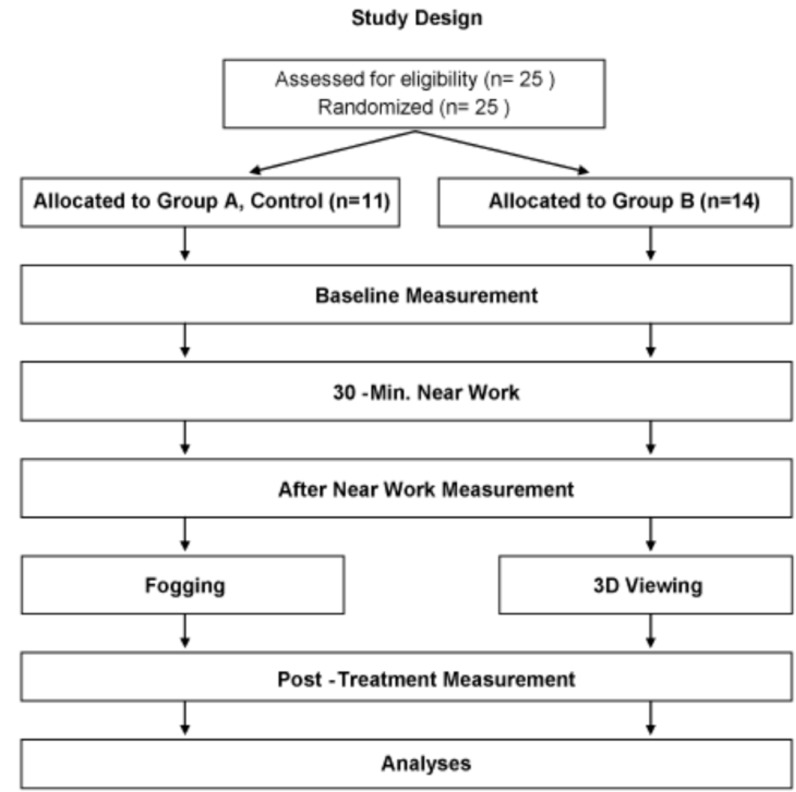
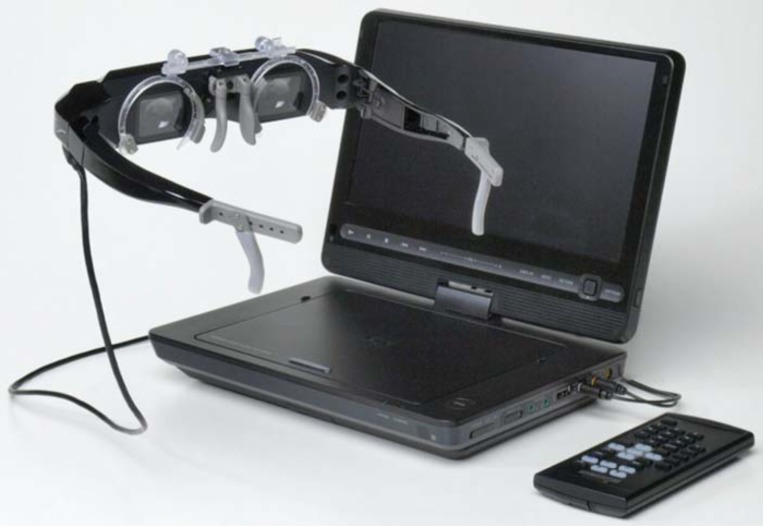
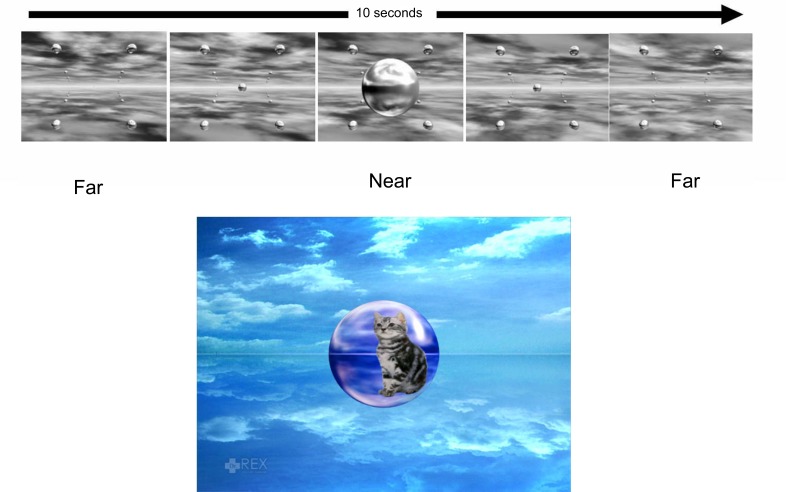
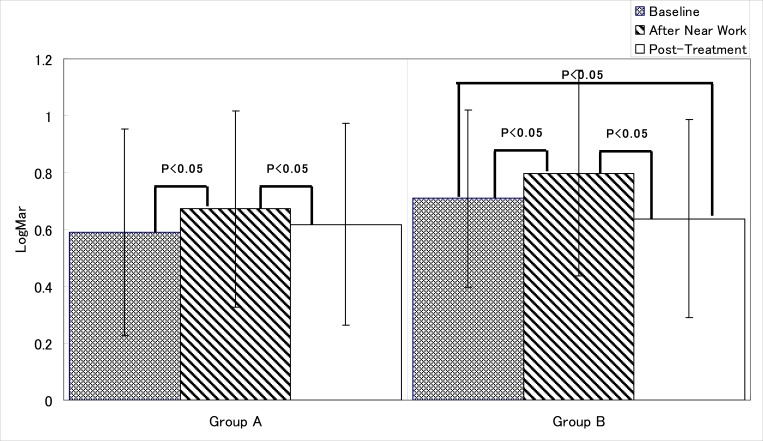
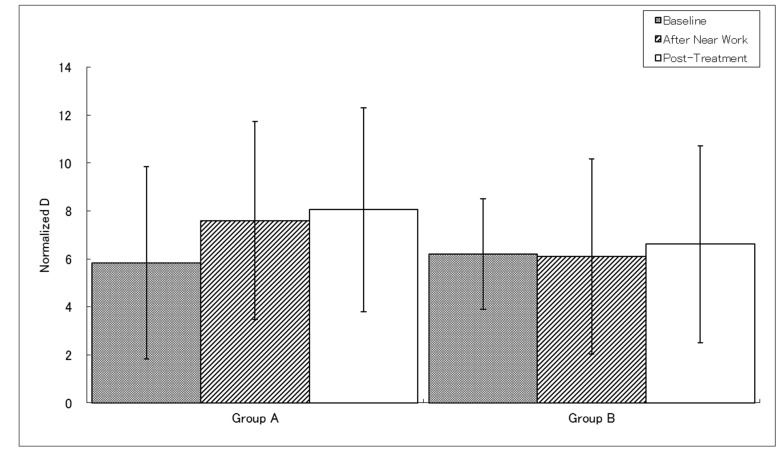
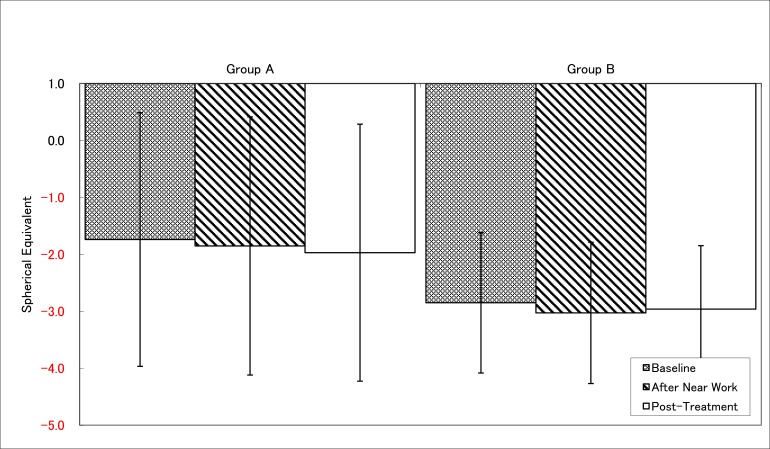
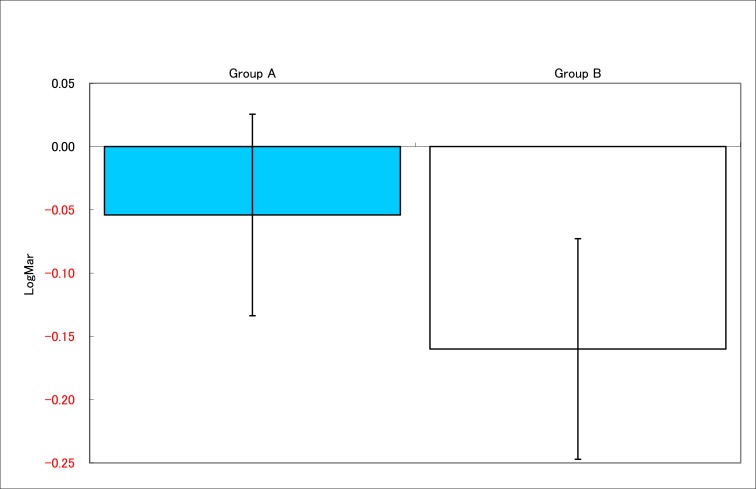
Methods: A prospective, randomized, pilot study to compare fogging method and the use of head mounted 3D display. Subjects were children, between 5 to 15 years old, with normal best corrected visual acuity (BCVA) and up to -3D myopia. Subjects played a video game as near point work, and received one of the two methods of treatments. Measurements of uncorrected far visual acuity (UCVA), refraction with autorefractometer, and subjective accommodative amplitude were taken 3 times, at the baseline, after the near work, and after the treatment.
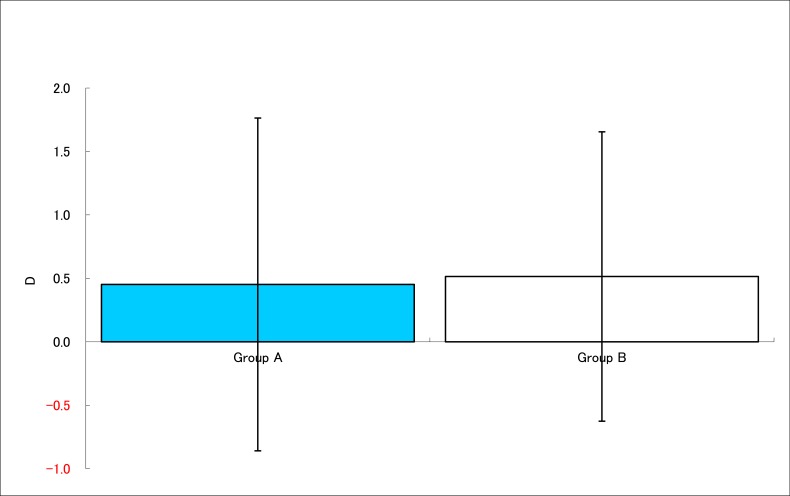
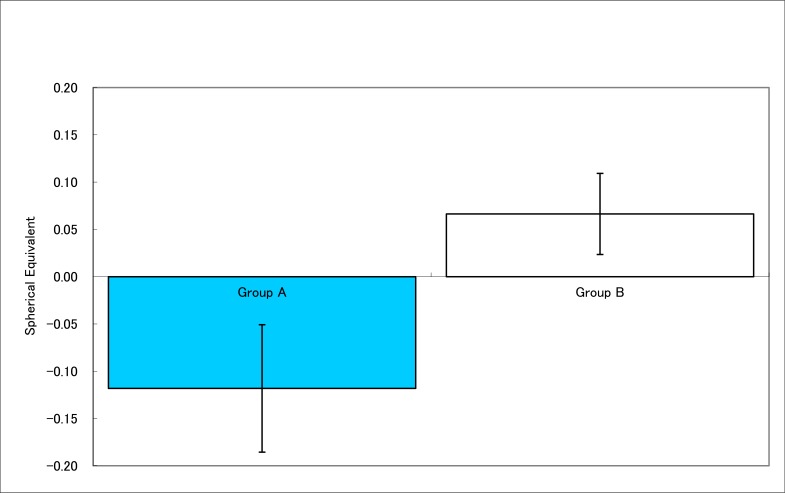
Results: Both methods applied after near work, improved UCVA. Head mounted 3D display group showed significant improvement in UCVA and resulted in better UCVA than baseline. Fogging group showed improvement in subjective accommodative amplitude. While 3D display group did not show change in the refraction, fogging group's myopic refraction showed significant increase indicating the eyes showed myopic change of eyes after near work and treatment.
Discussion: Despite our lack of clear knowledge in the mechanisms, both methods improved UCVA after the treatments. The improvement in UCVA was not correlated to measured refraction values.
Conclusion: UCVA after near work can be improved by repeating near and distant accommodation by fogging and 3D image viewing, although at the different degrees. Further investigation on mechanisms of improvements and their clinical significance are warranted.
Keywords: 3D; fogging; myopia; vision; visual acuity..
Figures
References
-
- Kuo A, Sinatra RB, Donahue SP. Distribution of refractive error in healthy infants. J AAPOS. 2003;7(3):174–7. - PubMed
-
- Norton TT, Siegwart JTJr. Animal models of emmetropization: matching axial length to the focal plane. J Am Optom Assoc. 1995;66(7):405–14. - PubMed
-
- Westall CA, Panton CM, Levin AV. Time courses for maturation of electroretinogram responses from infancy to adulthood. Doc Ophthalmol 1998. 1999;96(4):355–79. - PubMed
-
- Mutti DO. To emmetropize or not to emmetropize?.The question for hyperopic development. Optom Vis Sci. 2007;84(2):97–102. - PubMed
LinkOut - more resources
Full Text Sources
Other Literature Sources