

Prefrontal control of the amygdala during real-time fMRI neurofeedback training of emotion regulation
- PMID: 24223175
- PMCID: PMC3819266
- DOI: 10.1371/journal.pone.0079184
Prefrontal control of the amygdala during real-time fMRI neurofeedback training of emotion regulation
Abstract
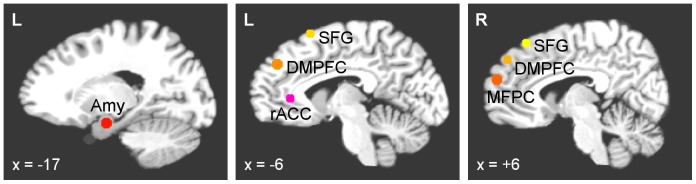
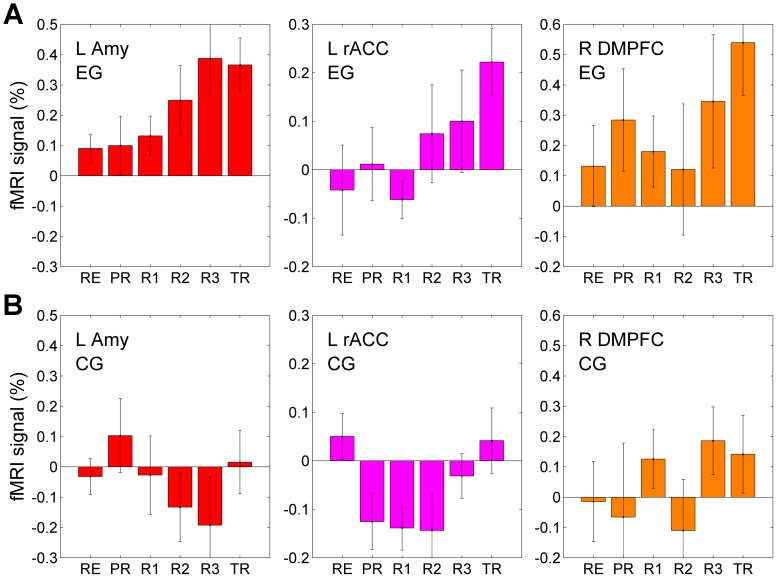
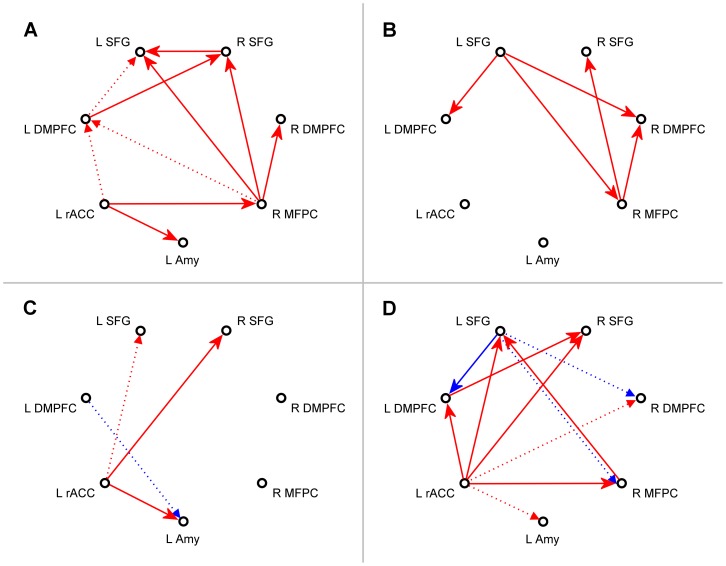
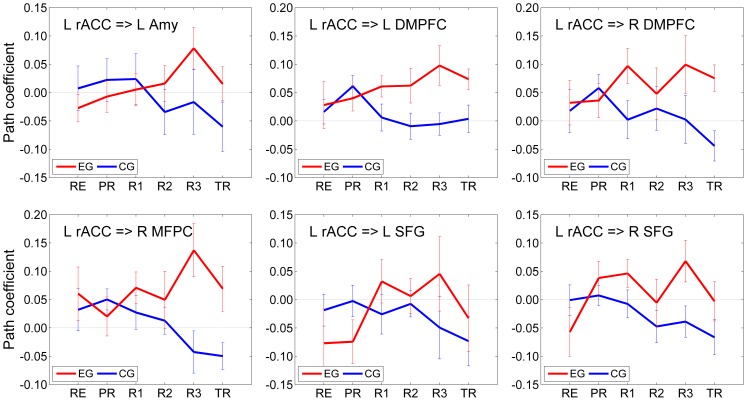
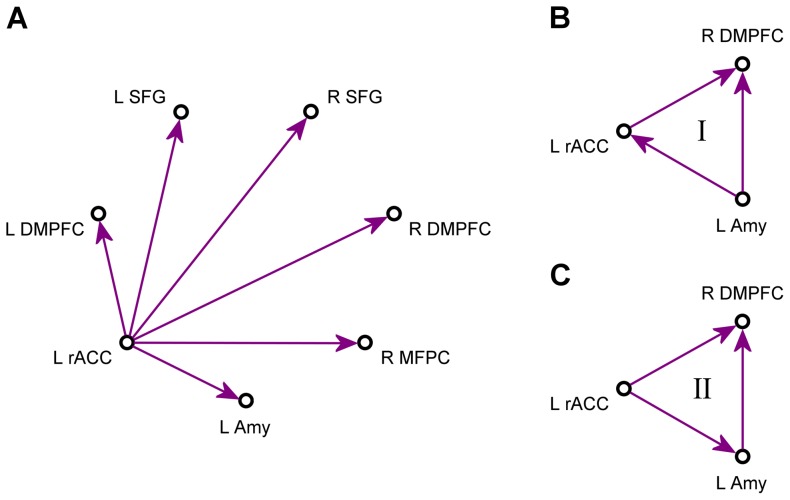
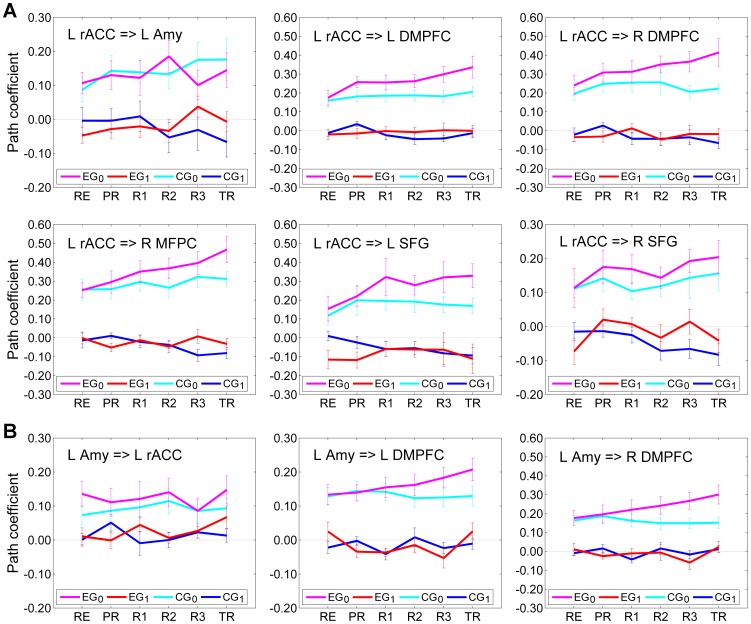
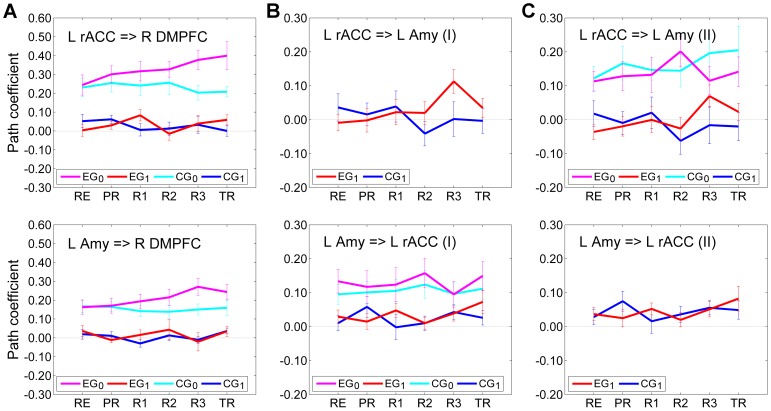
We observed in a previous study (PLoS ONE 6:e24522) that the self-regulation of amygdala activity via real-time fMRI neurofeedback (rtfMRI-nf) with positive emotion induction was associated, in healthy participants, with an enhancement in the functional connectivity between the left amygdala (LA) and six regions of the prefrontal cortex. These regions included the left rostral anterior cingulate cortex (rACC), bilateral dorsomedial prefrontal cortex (DMPFC), bilateral superior frontal gyrus (SFG), and right medial frontopolar cortex (MFPC). Together with the LA, these six prefrontal regions thus formed the functional neuroanatomical network engaged during the rtfMRI-nf procedure. Here we perform a structural vector autoregression (SVAR) analysis of the effective connectivity for this network. The SVAR analysis demonstrates that the left rACC plays an important role during the rtfMRI-nf training, modulating the LA and the other network regions. According to the analysis, the rtfMRI-nf training leads to a significant enhancement in the time-lagged effect of the left rACC on the LA, potentially consistent with the ipsilateral distribution of the monosynaptic projections between these regions. The training is also accompanied by significant increases in the instantaneous (contemporaneous) effects of the left rACC on four other regions - the bilateral DMPFC, the right MFPC, and the left SFG. The instantaneous effects of the LA on the bilateral DMPFC are also significantly enhanced. Our results are consistent with a broad literature supporting the role of the rACC in emotion processing and regulation. Our exploratory analysis provides, for the first time, insights into the causal relationships within the network of regions engaged during the rtfMRI-nf procedure targeting the amygdala. It suggests that the rACC may constitute a promising target for rtfMRI-nf training along with the amygdala in patients with affective disorders, particularly posttraumatic stress disorder (PTSD).
Conflict of interest statement
Figures
Similar articles
-
Real-time fMRI neurofeedback training of the amygdala activity with simultaneous EEG in veterans with combat-related PTSD.Neuroimage Clin. 2018 Apr 8;19:106-121. doi: 10.1016/j.nicl.2018.04.010. eCollection 2018. Neuroimage Clin. 2018. PMID: 30035008 Free PMC article.
-
Self-regulation of amygdala activation using real-time FMRI neurofeedback.PLoS One. 2011;6(9):e24522. doi: 10.1371/journal.pone.0024522. Epub 2011 Sep 8. PLoS One. 2011. PMID: 21931738 Free PMC article. Clinical Trial.
-
Real-time fMRI amygdala neurofeedback positive emotional training normalized resting-state functional connectivity in combat veterans with and without PTSD: a connectome-wide investigation.Neuroimage Clin. 2018 Aug 19;20:543-555. doi: 10.1016/j.nicl.2018.08.025. eCollection 2018. Neuroimage Clin. 2018. PMID: 30175041 Free PMC article.
-
Amygdala real-time functional magnetic resonance imaging neurofeedback for major depressive disorder: A review.Psychiatry Clin Neurosci. 2018 Jul;72(7):466-481. doi: 10.1111/pcn.12665. Epub 2018 May 21. Psychiatry Clin Neurosci. 2018. PMID: 29687527 Free PMC article. Review.
-
fMRI neurofeedback in emotion regulation: A literature review.Neuroimage. 2019 Jun;193:75-92. doi: 10.1016/j.neuroimage.2019.03.011. Epub 2019 Mar 9. Neuroimage. 2019. PMID: 30862532 Review.
Cited by
-
Effects of simultaneous real-time fMRI and EEG neurofeedback in major depressive disorder evaluated with brain electromagnetic tomography.Neuroimage Clin. 2020;28:102459. doi: 10.1016/j.nicl.2020.102459. Epub 2020 Oct 6. Neuroimage Clin. 2020. PMID: 33065473 Free PMC article.
-
Affective Interaction with a Virtual Character Through an fNIRS Brain-Computer Interface.Front Comput Neurosci. 2016 Jul 12;10:70. doi: 10.3389/fncom.2016.00070. eCollection 2016. Front Comput Neurosci. 2016. PMID: 27462216 Free PMC article.
-
Real-time FMRI neurofeedback training of amygdala activity in patients with major depressive disorder.PLoS One. 2014 Feb 11;9(2):e88785. doi: 10.1371/journal.pone.0088785. eCollection 2014. PLoS One. 2014. PMID: 24523939 Free PMC article.
-
Neurofeedback of the difference in activation of the anterior cingulate cortex and posterior insular cortex: two functionally connected areas in the processing of pain.Front Behav Neurosci. 2014 Oct 15;8:357. doi: 10.3389/fnbeh.2014.00357. eCollection 2014. Front Behav Neurosci. 2014. PMID: 25360092 Free PMC article.
-
Using real-time fMRI to influence effective connectivity in the developing emotion regulation network.Neuroimage. 2016 Jan 15;125:616-626. doi: 10.1016/j.neuroimage.2015.09.070. Epub 2015 Oct 22. Neuroimage. 2016. PMID: 26475487 Free PMC article. Clinical Trial.
References
-
- Ochsner KN, Bunge SA, Gross JJ, Gabrieli JDE (2002) Rethinking feelings: an fMRI study of the cognitive regulation of emotion. J Cogn Neurosci 14: 1215–1229. - PubMed
-
- Ochsner KN, Ray RD, Cooper JC, Robertson ER, Chopra S, et al. (2004) For better or for worse: neural systems supporting the cognitive down- and up-regulation of negative emotion. NeuroImage 23: 483–499. - PubMed
-
- Phan KL, Fitzgerald DA, Nathan PJ, Moore GJ, Uhde TW, et al. (2005) Neural substrates for voluntary suppression of negative affect: a functional magnetic resonance imaging study. Biol Psychiatry 57: 210–219. - PubMed
Publication types
MeSH terms
LinkOut - more resources
Full Text Sources
Other Literature Sources
Medical
