. 2013 Nov 6;8(11):e79961.
doi: 10.1371/journal.pone.0079961. eCollection 2013.

Activation of IFN-γ/STAT/IRF-1 in hepatic responses to Klebsiella pneumoniae infection

Affiliations

Activation of IFN-γ/STAT/IRF-1 in hepatic responses to Klebsiella pneumoniae infection

Yi-Chun Lin et al. PLoS One. .

Abstract

Background: Klebsiella pneumoniae-caused liver abscess (KLA) has become a health problem in Taiwan and is continually reported in other countries. Diabetes mellitus, the most common metabolic disorder, underlies half of the KLA patients in Taiwan. The clinical impact of KLA has been well-documented. Nevertheless, the molecular basis regarding how K. pneumoniae causes liver infection, particularly in diabetic individuals, remains unclear.

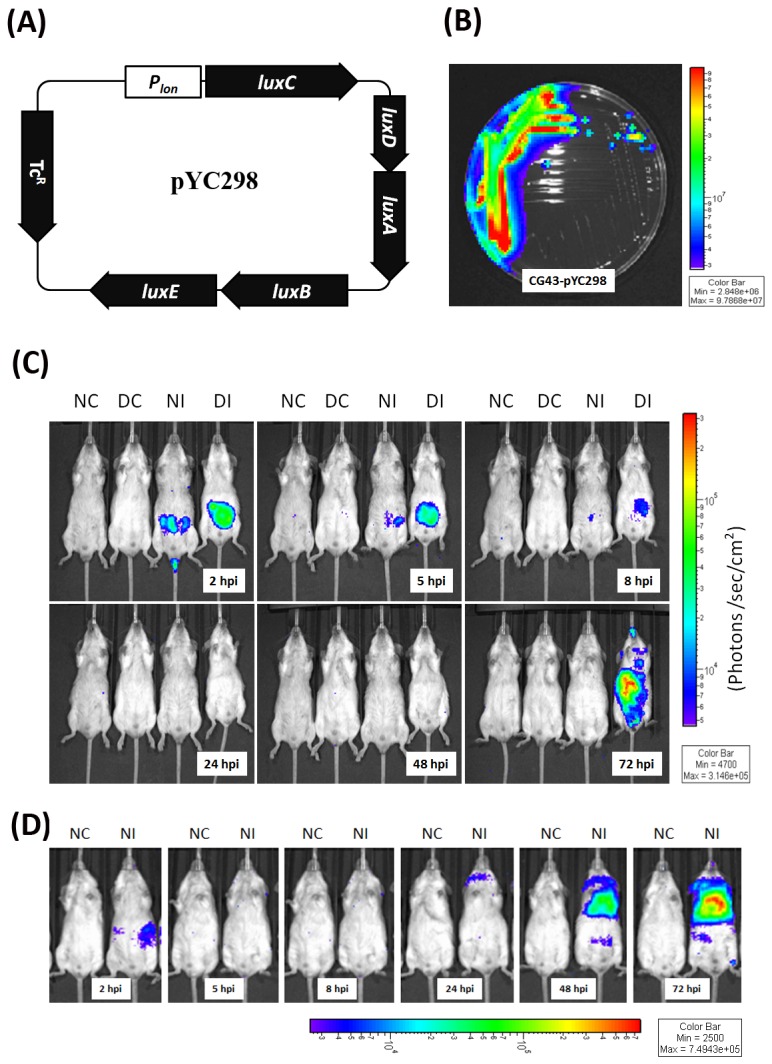
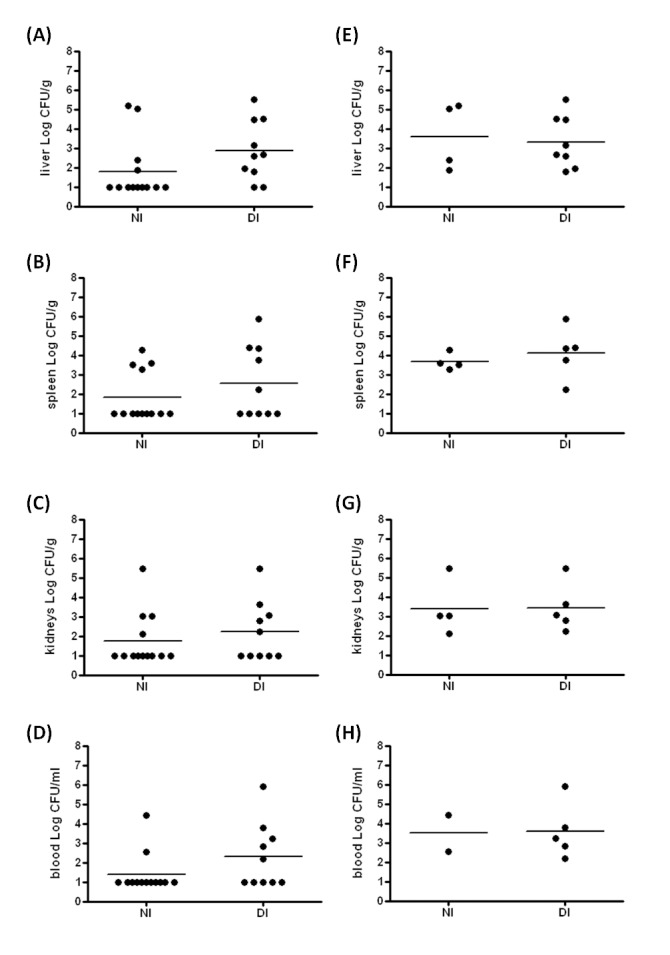
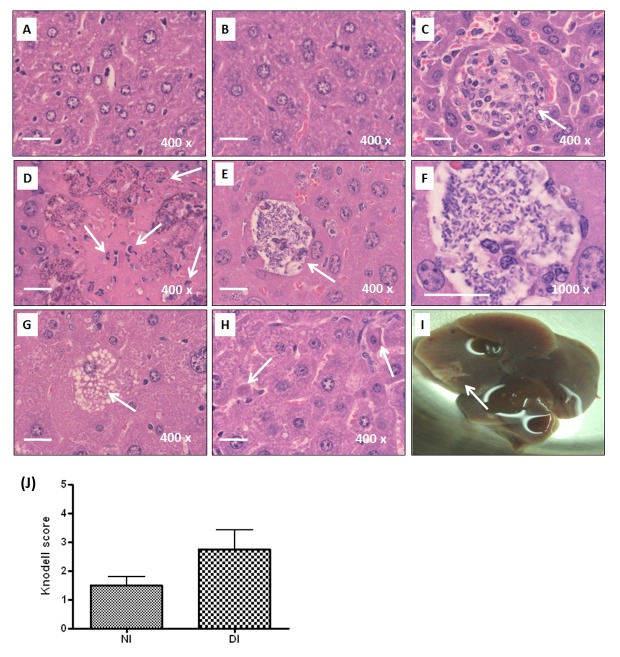
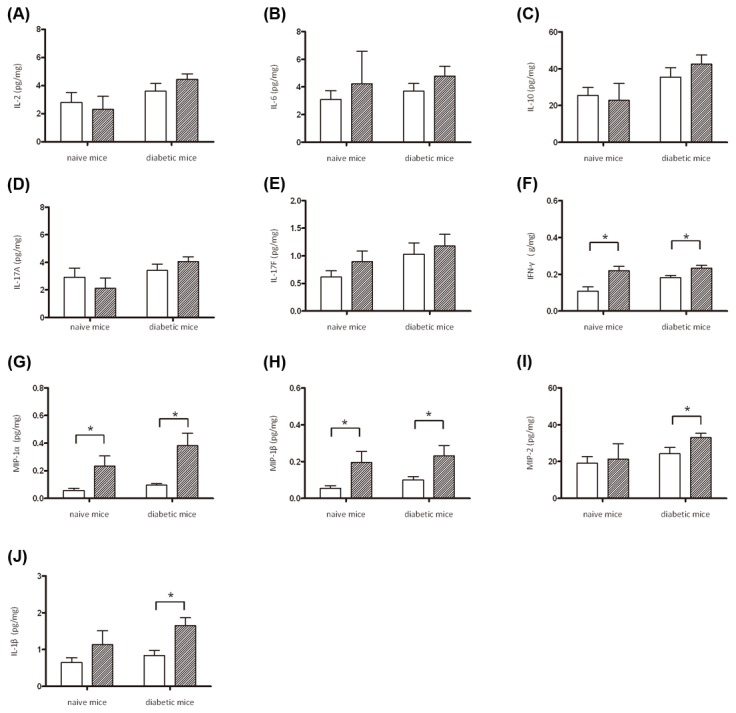
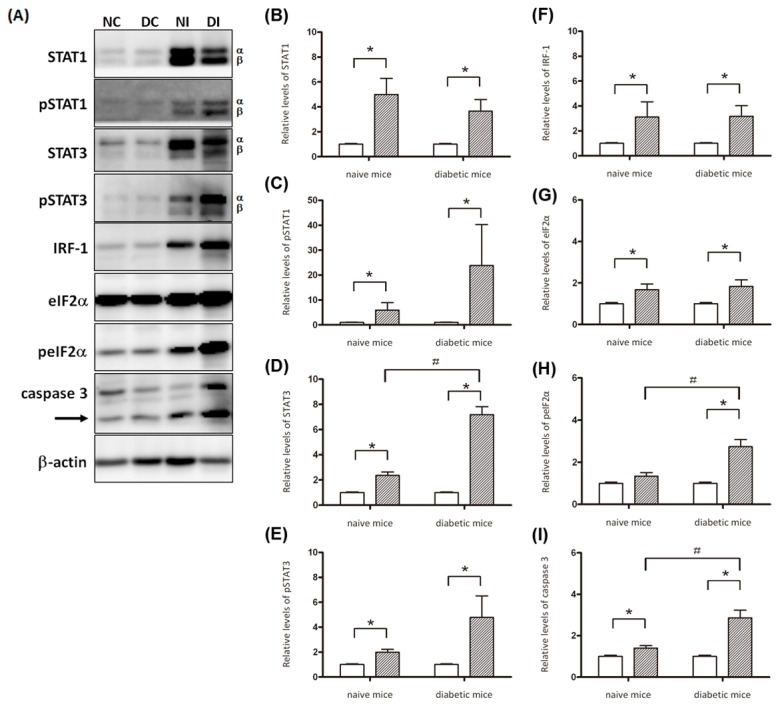
Methodology/principle findings: Auto-bioluminescence-expressing K. pneumoniae was inoculated into diabetic mice and age-match naïve control. With the use of in vivo imaging system, translocation of the bioluminescence-expressing K. pneumoniae from intestine to extraintestinal organs, mainly the liver, was noted in 80% of the diabetic mice, whereas the same bacteria causes extraintestinal infections in only 31% of naïve mice. Besides increased morbidity, the severity of hepatic tissue injury was also enhanced in the K. pneumoniae-infected diabetic mice. Upon K. pneumoniae infection, IFN-γ production was significantly evoked in the liver. To mediate IFN-γ signal, STAT (signal transducers and activators of transcription) 1 and 3 were activated in hepatocytes, and so was the expression of IRF (interferon regulatory factor)-1. Moreover, accumulation of neutrophils which was triggered by prolonged production of IL-1β and MIP-2, and significant increases in the level of active caspase 3 and phospho-eIF2α, were exclusively revealed in the K. pneumoniae-infected diabetic mice.

Conclusion: The activation of IFN-γ/STAT/IRF-1 signaling demonstrated by this work emphasizes the role of IFN-γ for mediating the hepatic response to K. pneumoniae infection.


Conflict of interest statement

Competing Interests: The authors have declared that no competing interests exist.

Figures

Figure 1
Figure 1. In vivo imaging of auto-bioluminescence-expressing K. pneumoniae.
(A) Map of pYC298. (B) Detection of bioluminescence light signals of K. pneumoniae CG43-pYC298 cultured on LB plate. (C-D) Groups of 15-wk-old male BALB/c mice were orally inoculated with PBS or 3 × 10⁸ CFU of log-phased K. pneumoniae CG43-pYC298. The mice were imaged at 2, 5, 8, 24, 48 and 72 hpi using the Xenogen IVIS system. The color overlay on the image represents the photons/second emitted from the mice in accord with the pseudo-color scale shown near to the images. Red represents the highest photons/second, while purple represents the lowest photons/second. The data are expressed as photons/seconds/cm2 in PBS-control naïve mice (NC), PBS-control diabetic mice (DC), K. pneumoniae-infected naive mice (NI) and K. pneumoniae-infected diabetic mice (DI), respectively from left to right.
Figure 2
Figure 2. Bacterial burdens of extraintestinal organs upon K. pneumoniae infection in diabetic and naïve mice.
Liver (A and E), spleen (B and F), kidneys (C and G), and blood (D and H) were retrieved at 72 hpi from the naive mice (NI) and diabetic mice (DI) which were orally inoculated with 3 × 10⁸ CFU of log-phased K. pneumoniae CG43-luxCDABE. Ten-folded dilutes of the tissue homogenates were plated onto LB-TcR agar to enumerate CFU. Bacterial burdens were represented as Log CFU/g for tissues and Log CFU/ml for blood. Data from all the K. pneumoniae-inoculated naïve and diabetic mice were shown in A to D. Horizontal bars indicate geometric means. The limit of detection was approximately 10 CFU. Samples which yielded no colonies were plotted having the value as 10 CFU g-1 tissues. For emphasizing the extraintestinal dissemination of K. pneumoniae, samples that yielded no colonies in extraintestinal tissues were considered non-infected. Only data from the K. pneumoniae-positive samples were plotted in E to H. Statistical analysis by the Mann-Whitney U test (one-tailed) showed no significant difference between NI and DI groups. The sample sizes in A-D are 13 and 10 in NI and DI groups and are 4 and 8 in E-H for NI and DI groups, respectively.
Figure 3
Figure 3. Histopathological examination of liver.
For all the experimental groups, liver sections were prepared from the liver retrieved at 72 hpi, stained with H/E, and imaged under microscopic observation with magnification of 400×. Representative liver sections of PBS-control naïve mice (A), PBS-control diabetic mice (B), and the K. pneumoniae-infected naïve mice (C) are shown. Infiltrates of neutrophils and lymphocytes are indicated with arrows. Several characteristics revealed on the liver section from the K. pneumoniae-infected diabetic mice, including liquefactive necrosis with degeneration of liver parenchyma and inflammatory cells (D), accumulation of K. pneumoniae (E and F), ballooning degeneration of hepatocytes (G), and the formation of Councilman body (H) are shown with an indication of arrows. A large hepatic abscess was noted in the right liver lobe of a K. pneumoniae-infected diabetic mouse (I). Scale bar represents a distance of 20 μm. (J) Hepatic injury graded by the Knodell necroinflammatory scoring system. Livers were retrieved from K. pneumoniae-infected naïve mice (NI; n=4) and diabetic mice (DI; n=8). Statistical analysis by the Mann-Whitney U test (one-tailed) showed no significant difference between NI and DI groups.
Figure 4
Figure 4. Production of cytokines and chemokines in hepatic responses to K. pneumoniae infection.
Liver lysates were prepared from PBS-control naïve mice (n=3), PBS-control diabetic mice (n=3), and the K. pneumoniae-inoculated naive and diabetic mice which had developed an extraintestinal infection at 72 hpi (the sample size in naïve and diabetic groups is 4 and 8, respectively). Protein levels of IL-2 (A), IL-6 (B), IL-10 (C), IL-17A (D), and IL-17F (E), IFN-γ (F), MIP-1α (G), MIP1β (H), MIP-2 (I), and IL-1β (J) were determined by ELISA and normalized with total protein amounts. Data are expressed as the mean ± SEM. An asterisk (*) represents a significant increase in the K. pneumoniae-infected naïve or diabetic group (slash bar) in comparison with the corresponding control group (empty bar) by the Mann-Whitney U test (one-tailed; P < 0.05).
Figure 5
Figure 5. Activation of IFN-γ/STAT/IRF-1 signaling in hepatic responses to K. pneumoniae infection.
Liver lysates were prepared from PBS-control naïve mice (n=3), PBS-control diabetic mice (n=3), and the K. pneumoniae-inoculated naive and diabetic mice which had developed an extraintestinal infection at 72 hpi (the sample size in naïve and diabetic groups is 4 and 8, respectively). Thirty micrograms of total proteins were subjected to Western blot analyses with specific antibodies. Western blotting analysis was repeated for three times by independent experiments. A representative result is shown in (A). Band intensity for each protein was determined by Densitometry calculation and normalized with β-actin. Data from three independent experiments for the expression level of (B) STAT1, (C) phospho-STAT1, (D) STAT3, (E) phospho-STAT3, (F) IRF-1, (G) eIF2α, (H) phospho-eIF2α, and (I) activated caspase 3 are shown as means ± SEM. Statistical analysis was performed by the Mann-Whitney U test (one-tailed). *P < 0.05 (one-tailed) represents a significant increase in the K. pneumoniae-infected naïve or diabetic group (slash bar) in comparison with the corresponding control group (empty bar). P < 0.05 (one-tailed) for significant difference between the naïve and diabetic mice which were K. pneumoniae-infected.
Figure 6
Figure 6. Immunohistochemistry analysis.
Distribution of phospho-STAT1 (A, D, and G), phospho-STAT3 (B, E, and H), and IRF-1 (C, F, and I) are shown in the liver of the PBS-control (A, B, and C), K. pneumoniae-infected diabetic mice (D, E, and F), and K. pneumoniae-infected naïve mice (G, H, and I). Scale bar represents a distance of 50 μm.
Figure 7
Figure 7. K. pneumoniae-induced hepatic apoptosis.
Liver sections of PBS-control naïve mice (A), K. pneumoniae-infected naïve mice (B), PBS-control diabetic mice (C), and K. pneumoniae-infected diabetic mice (D) were subjected to TUNEL analysis. The nuclei of apoptotic cells have been stained brown with the TUNEL method. Scale bar represents a distance of 50 μm.

Similar articles

Cited by

References

    1. Podschun R, Ullmann U (1998) Klebsiella spp. as Nosocomial Pathogens: Epidemiology, Taxonomy, Typing Methods, and Pathogenicity Factors. Clin Microbiol Rev 11: 589-603. PubMed: 9767057. - PMC - PubMed
    1. Wang JH, Liu YC, Lee SS, Yen MY, Chen YS et al. (1998) Primary liver abscess due to Klebsiella pneumoniae in Taiwan. Clin Infect Dis 26: 1434-1438. doi:10.1086/516369. PubMed: 9636876. - DOI - PubMed
    1. Chung DR, Lee SS, Lee HR, Kim HB, Choi HJ et al. (2007) Emerging invasive liver abscess caused by K1 serotype Klebsiella pneumoniae in Korea. J Infect 54: 578-583. doi:10.1016/j.jinf.2006.11.008. PubMed: 17175028. - DOI - PubMed
    1. Karama EM, Willermain F, Janssens X, Claus M, Van den Wijngaert S et al. (2008) Endogenous endophthalmitis complicating Klebsiella pneumoniae liver abscess in Europe: case report. Int Ophthalmol 28: 111-113. doi:10.1007/s10792-007-9111-4. PubMed: 17668150. - DOI - PubMed
    1. Nadasy KA, Domiati-Saad R, Tribble MA (2007) Invasive Klebsiella pneumoniae syndrome in North America. Clin Infect Dis 45: e25-e28. doi:10.1086/519424. PubMed: 17599300. - DOI - PubMed

Publication types