. 2013 Nov 6;8(11):e80501.
doi: 10.1371/journal.pone.0080501. eCollection 2013.

Determining the binding affinity of therapeutic monoclonal antibodies towards their native unpurified antigens in human serum

Affiliations

Determining the binding affinity of therapeutic monoclonal antibodies towards their native unpurified antigens in human serum

Christine Bee et al. PLoS One. .

Abstract

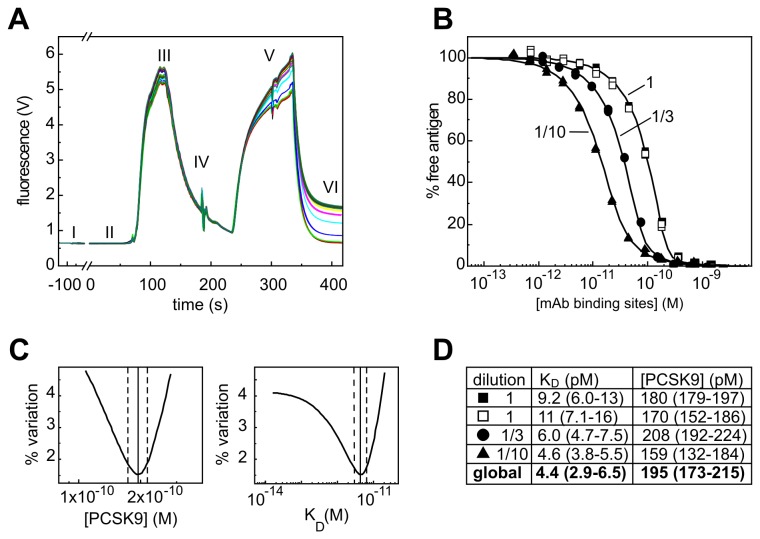
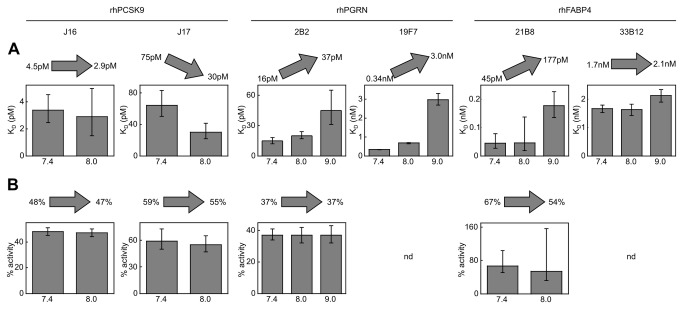
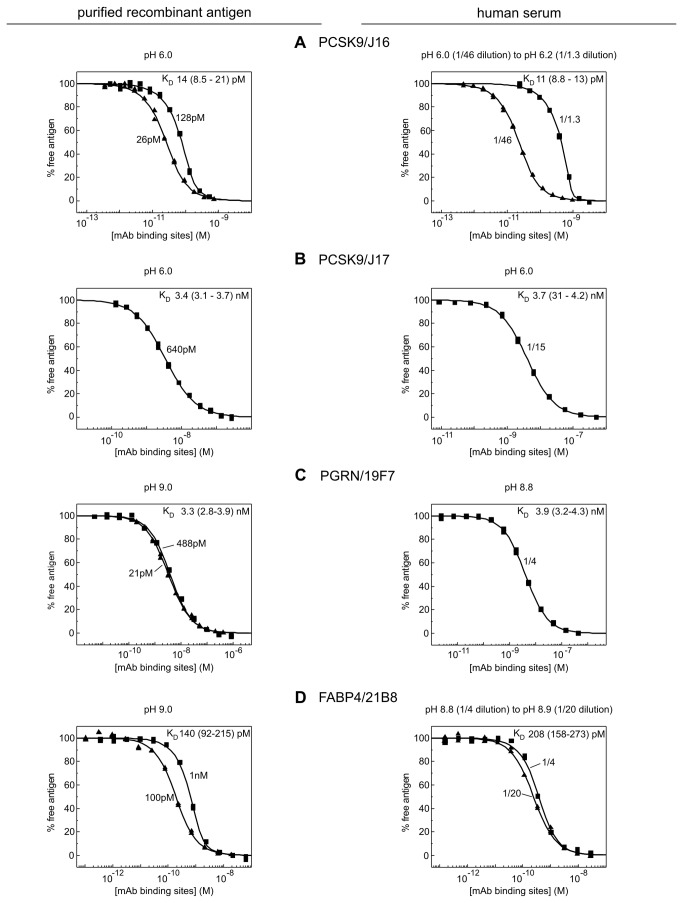
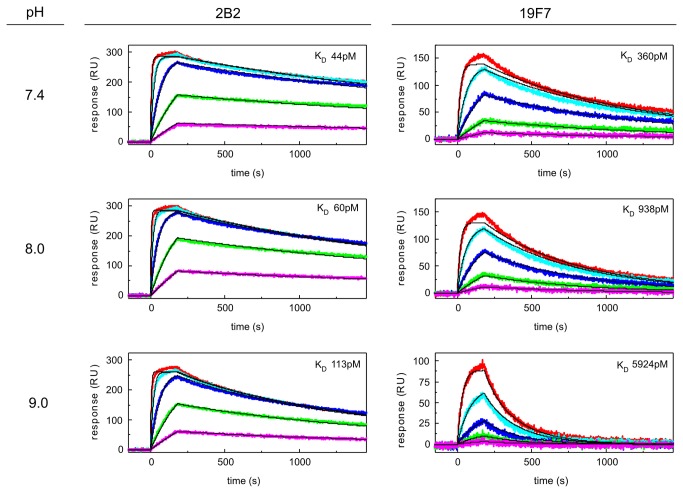
Monoclonal antibodies (mAbs) are a growing segment of therapeutics, yet their in vitro characterization remains challenging. While it is essential that a therapeutic mAb recognizes the native, physiologically occurring epitope, the generation and selection of mAbs often rely on the use of purified recombinant versions of the antigen that may display non-native epitopes. Here, we present a method to measure both, the binding affinity of a therapeutic mAb towards its native unpurified antigen in human serum, and the antigen's endogenous concentration, by combining the kinetic exclusion assay and Biacore's calibration free concentration analysis. To illustrate the broad utility of our method, we studied a panel of mAbs raised against three disparate soluble antigens that are abundant in the serum of healthy donors: proprotein convertase subtilisin/kexin type 9 (PCSK9), progranulin (PGRN), and fatty acid binding protein (FABP4). We also determined the affinity of each mAb towards its purified recombinant antigen and assessed whether the interactions were pH-dependent. Of the six mAbs studied, three did not appear to discriminate between the serum and recombinant forms of the antigen; one mAb bound serum antigen with a higher affinity than recombinant antigen; and two mAbs displayed a different affinity for serum antigen that could be explained by a pH-dependent interaction. Our results highlight the importance of taking pH into account when measuring the affinities of mAbs towards their serum antigens, since the pH of serum samples becomes increasingly alkaline upon aerobic handling.


Conflict of interest statement

Competing Interests: All authors are employed by Pfizer Inc. This does not alter the authors' adherence to all the PLOS ONE policies on sharing data and materials.

Figures

Figure 1
Figure 1. Human serum titrated with anti-PCSK9 mAb J16.
(A) Raw data trace of fluorescence (in Volts) as a function of time recorded by the KinExA instrument for a typical experiment: (I) packing of mAb-coated beads inside the flow cell; (II) baseline signal; (III) auto-fluorescence signal obtained from serum components (presumably porphyrins); (IV) buffer wash; (V) detection of bead-captured PCSK9 with a Dylight-labeled mAb; and (VI) buffer wash, after which the final fluorescence signal for bead-captured PCSK9 is recorded (relative to the baseline signal). (B) Global fit of normalized data obtained from titrating J16 into different dilutions of serum prepared in PBS. (C) Error plots for KD and PCSK9 concentration for the global analysis in panel B with best fit values (solid line) and 95% confidence interval (dotted lines). (D) Comparison of the fits obtained for single-curve and multi-curve (global) analysis of the data in panel B. The PCSK9 concentration is back-calculated for undiluted serum. Open and closed symbols indicate independent experiments performed with the same dilution factor.
Figure 2
Figure 2. KinExA-determined affinities of three different mAbs (J16, 19F7, and 21B8) towards their purified recombinant antigens (left) and native antigens in human serum (right).
The fixed concentration of recombinant antigen (as determined by CFCA) used to generate each titration curve is indicated on the plots. For serum assays, the dilution factor is shown instead. The best fit KD (and 95% confidence interval) is reported on each panel.
Figure 3
Figure 3. KinExA-determined affinities of three mAbs (J17, 2B2, and 33B12) towards their purified recombinant antigens (left) and native antigens in human serum (right).
The data are presented in the same way as in Figure 2.
Figure 4
Figure 4. Influence of pH on the apparent affinity (top) and apparent activity (bottom) of different mAbs towards their purified recombinant antigens.
The KD values and mAb activities for each interaction were obtained from a single curve KinExA analysis performed at different pH values that spanned the pH range encountered during serum experiments. The bars represent the best fit values and the error bars represent the 95% confidence interval. The arrows indicate the trend observed with increasing pH and the range of best fit values for KD and activity. Only sweet spot experiments enabled a determination of both the KD and the mAb activity (no mAb activity is reported for 19F7 and 33B12 because those curves were mostly KD-controlled). The antigen concentrations used were 128 pM rhPCSK9, 42 pM rhPGRN, 21 pM rhPGRN, 100 pM rhFABP4, and 1nM rhFABP4 (from left to right).
Figure 5
Figure 5. KinExA-determined apparent affinities for four mAbs (J16, J17, 19F7, and 21B8) towards their purified recombinant antigens (left) and their serum antigens (right) at stable, non-neutral pH values.
Titration curves are presented as described in Figure 2.
Figure 6
Figure 6. Kinetic analysis of anti-PGRN mAbs 2B2 (left) and 19F7 (right) in TBST buffers at different pH values.
The data were collected on a ProteOn XPR36 biosensor by injecting a dilution series of rhPGRN (0.8, 2.4, 7.1, 21.3, and 64 nM) over amine-coupled mAbs. Double-referenced sensorgrams (colored lines) obtained from two ligand channels per mAb were fit globally to a 1:1 binding model with mass transport limitation (fit shown in black); the results from one channel per mAb is shown along with the global best fit KD.

References

    1. Day YSN, Baird CL, Rich RL, Myszka DG (2002) Direct comparison of binding equilibrium, thermodynamic, and rate constants determined by surface- and solution-based biophysical methods. Protein Sci 11: 1017–1025. doi:10.1110/ps.4330102. PubMed: 11967359. - DOI - PMC - PubMed
    1. Myszka DG, Abdiche YN, Arisaka F, Byron O, Eisenstein E et al. (2003) The ABRF-MIRG’02 study: assembly state, thermodynamic, and kinetic analysis of an enzyme/inhibitor interaction. J Biomol Tech 14: 247–269. - PMC - PubMed
    1. Bee C, Abdiche YN, Stone DM, Collier S, Lindquist KC et al. (2012) Exploring the dynamic range of the kinetic exclusion assay in characterizing antigen-antibody interactions. PLOS ONE 7: e36261. doi:10.1371/journal.pone.0036261. PubMed: 22558410. - DOI - PMC - PubMed
    1. Drake AW, Myszka DG, Klakamp SL (2004) Characterizing high-affinity antigen/antibody complexes by kinetic- and equilibrium-based methods. Anal Biochem 328: 35–43. doi:10.1016/j.ab.2003.12.025. PubMed: 15081905. - DOI - PubMed
    1. Abdiche YN, Lindquist KC, Pinkerton A, Pons J, Rajpal A (2011) Expanding the ProteOn XPR36 biosensor into a 36-ligand array expedites protein interaction analysis. Anal Biochem 411: 139–151. doi:10.1016/j.ab.2010.12.020. PubMed: 21168382. - DOI - PubMed

Publication types

MeSH terms