

Statistics on cannabis users skew perceptions of cannabis use
- PMID: 24223560
- PMCID: PMC3818642
- DOI: 10.3389/fpsyt.2013.00138
Statistics on cannabis users skew perceptions of cannabis use
Erratum in
- Front Psychiatry. 2013;4:180
Abstract
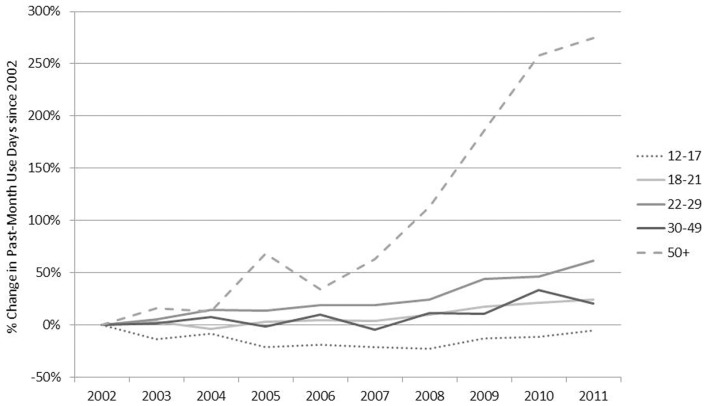
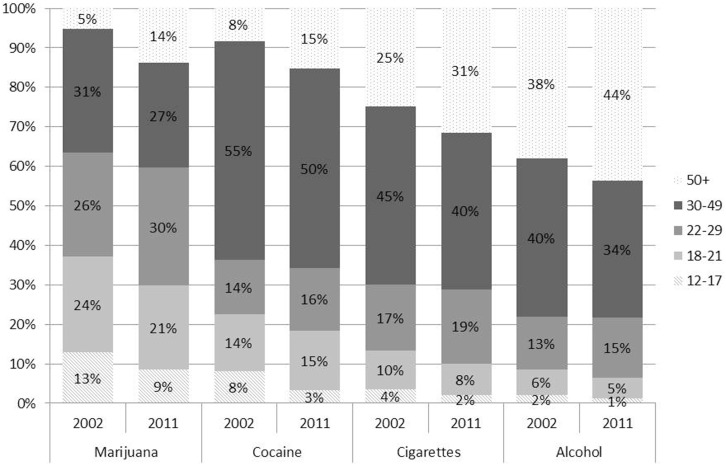
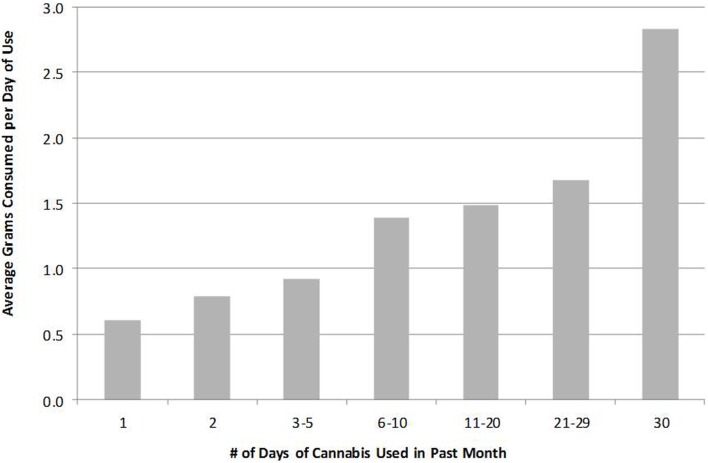
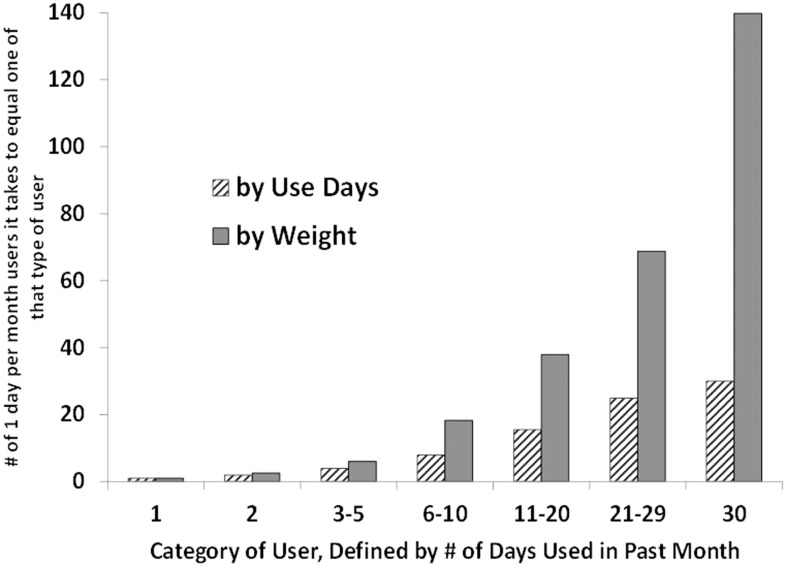
Collecting information about the prevalence of cannabis use is necessary but not sufficient for understanding the size, dynamics, and outcomes associated with cannabis markets. This paper uses two data sets describing cannabis consumption in the United States and Europe to highlight (1) differences in inferences about sub-populations based on the measure used to quantify cannabis-related activity; (2) how different measures of cannabis-related activity can be used to more accurately describe trends in cannabis usage over time; and (3) the correlation between frequency of use in the past-month and average grams consumed per use-day.
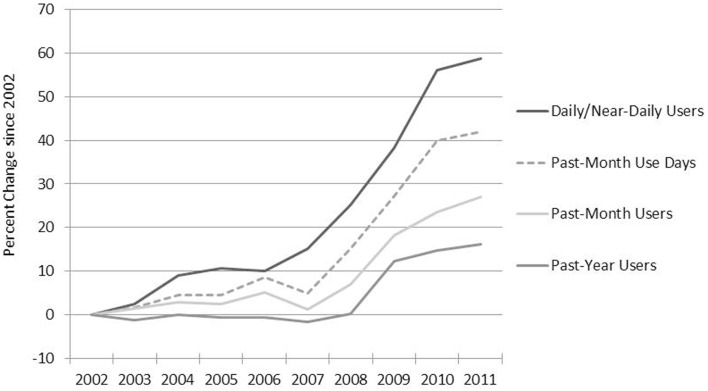
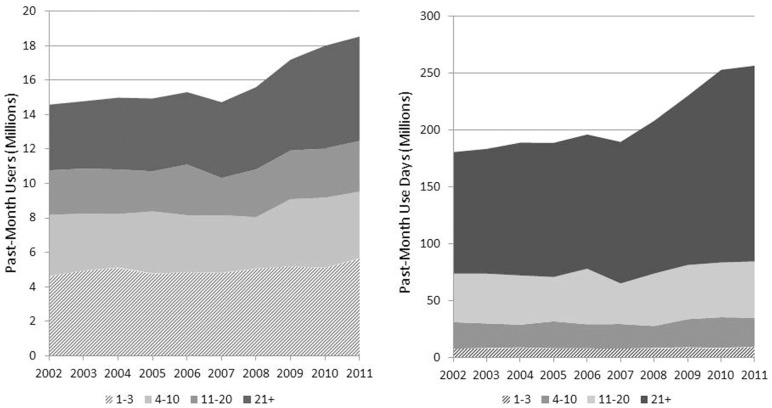
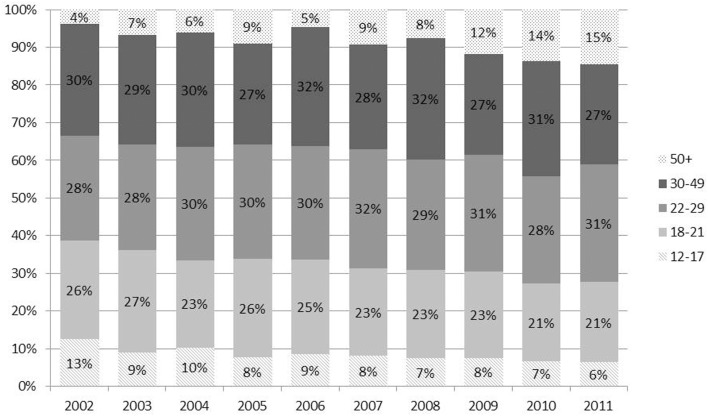
Key findings: focusing on days of use instead of prevalence shows substantially greater increases in U.S. cannabis use in recent years; however, the recent increase is mostly among adults, not youth. Relatively more rapid growth in use days also occurred among the college-educated and Hispanics. Further, data from a survey conducted in seven European countries show a strong positive correlation between frequency of use and quantity consumed per day of use, suggesting consumption is even more skewed toward the minority of heavy users than is suggested by days-of-use calculations.
Keywords: cannabis; drug use metrics; drug use trends; marijuana; substance abuse research.
Figures
References
-
- Everingham SS, Rydell CP. Modeling the Demand for Cocaine. Santa Monica, CA: RAND Corporation; (1994).
-
- Harrison LS, Martin SS, Enev T, Harrington D. Comparing Drug Testing and Self-Report of Drug use Among Youths and Young Adults in the General Population. Rockville, MD: Department of Health and Human Services; (2007). Substance Abuse and Mental Health Services Administration, Office of Applied Studies, (SMA)07-4249.
-
- Wright D, Gfroerer J, Epstein J. The use of external data sources and ratio estimation to improve estimates of hardcore drug use from the NHSDA. NIDA Res Monogr (1997) 167:477–97 - PubMed
-
- van Laar M, Frijns T, Trautmann F, Lombi L. Cannabis market: user types, availability and consumption estimates. In: Trautman F, Kilmer B, Turnbull P, editors. Further Insights into Aspects of the Illicit EU Drugs Market. Luxembourg: Publications Office of the European Union; (2013). p. 73–182
-
- Caulkins JP, Kilmer B, Graf M. Estimating the size of the EU cannabis market. In: Trautman F, Kilmer B, Turnbull P, editors. Further Insights into Aspects of the Illicit EU Drugs Market. Luxembourg: Publications Office of the European Union; (2013). p. 289–322
LinkOut - more resources
Full Text Sources
Other Literature Sources
Miscellaneous