Fatty acid synthase as a factor required for exercise-induced cognitive enhancement and dentate gyrus cellular proliferation
- PMID: 24223732
- PMCID: PMC3818398
- DOI: 10.1371/journal.pone.0077845
Fatty acid synthase as a factor required for exercise-induced cognitive enhancement and dentate gyrus cellular proliferation
Abstract
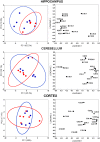
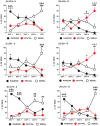
Voluntary running is a robust inducer of adult hippocampal neurogenesis. Given that fatty acid synthase (FASN), the key enzyme for de novo fatty acid biosynthesis, is critically involved in proliferation of embryonic and adult neural stem cells, we hypothesized that FASN could mediate both exercise-induced cell proliferation in the subgranular zone (SGZ) of the dentate gyrus (DG) and enhancement of spatial learning and memory. In 20 week-old male mice, voluntary running-induced hippocampal-specific upregulation of FASN was accompanied also by hippocampal-specific accumulation of palmitate and stearate saturated fatty acids. In experiments addressing the functional role of FASN in our experimental model, chronic intracerebroventricular (i.c.v.) microinfusions of C75, an irreversible FASN inhibitor, and significantly impaired exercise-mediated improvements in spatial learning and memory in the Barnes maze. Unlike the vehicle-injected mice, the C75 group adopted a non-spatial serial escape strategy and displayed delayed escape latencies during acquisition and memory tests. Furthermore, pharmacologic blockade of FASN function with C75 resulted in a significant reduction, compared to vehicle treated controls, of the number of proliferative cells in the DG of running mice as measured by immunoreactive to Ki-67 in the SGZ. Taken together, our data suggest that FASN plays an important role in exercise-mediated cognitive enhancement, which might be associated to its role in modulating exercise-induced stimulation of neurogenesis.
Conflict of interest statement
Figures


Similar articles
-
Regular voluntary exercise cures stress-induced impairment of cognitive function and cell proliferation accompanied by increases in cerebral IGF-1 and GST activity in mice.Behav Brain Res. 2010 Aug 25;211(2):178-84. doi: 10.1016/j.bbr.2010.03.028. Epub 2010 Mar 20. Behav Brain Res. 2010. PMID: 20307585
-
Effects of Voluntary Wheel Running Exercise on Chemotherapy-Impaired Cognitive and Motor Performance in Mice.Int J Environ Res Public Health. 2023 Apr 3;20(7):5371. doi: 10.3390/ijerph20075371. Int J Environ Res Public Health. 2023. PMID: 37047984 Free PMC article.
-
[Voluntary wheel running enhances cell proliferation and expression levels of BDNF, IGF1 and WNT4 in dentate gyrus of adult mice].Sheng Li Xue Bao. 2014 Oct 25;66(5):559-68. Sheng Li Xue Bao. 2014. PMID: 25332001 Chinese.
-
Overexpressed Fatty Acid Synthase in Gastrointestinal Stromal Tumors: Targeting a Progression-Associated Metabolic Driver Enhances the Antitumor Effect of Imatinib.Clin Cancer Res. 2017 Aug 15;23(16):4908-4918. doi: 10.1158/1078-0432.CCR-16-2770. Epub 2017 Apr 25. Clin Cancer Res. 2017. PMID: 28442505
-
Adult neurogenesis in the mammalian dentate gyrus.Anat Histol Embryol. 2020 Jan;49(1):3-16. doi: 10.1111/ahe.12496. Epub 2019 Sep 30. Anat Histol Embryol. 2020. PMID: 31568602 Review.
Cited by
-
Decreased expression of miR-195 mediated by hypermethylation promotes osteosarcoma.Open Med (Wars). 2022 Mar 7;17(1):441-452. doi: 10.1515/med-2022-0441. eCollection 2022. Open Med (Wars). 2022. PMID: 35350838 Free PMC article.
-
Physical activity reduces anxiety and regulates brain fatty acid synthesis.Mol Brain. 2020 Apr 17;13(1):62. doi: 10.1186/s13041-020-00592-7. Mol Brain. 2020. PMID: 32303271 Free PMC article.
-
Long-Term Mild, rather than Intense, Exercise Enhances Adult Hippocampal Neurogenesis and Greatly Changes the Transcriptomic Profile of the Hippocampus.PLoS One. 2015 Jun 10;10(6):e0128720. doi: 10.1371/journal.pone.0128720. eCollection 2015. PLoS One. 2015. PMID: 26061528 Free PMC article.
-
Mitochondrial and Autophagic Regulation of Adult Neurogenesis in the Healthy and Diseased Brain.Int J Mol Sci. 2021 Mar 24;22(7):3342. doi: 10.3390/ijms22073342. Int J Mol Sci. 2021. PMID: 33805219 Free PMC article. Review.
-
Neural Metabolic Networks: Key Elements of Healthy Brain Function.J Neurochem. 2025 Jun;169(6):e70084. doi: 10.1111/jnc.70084. J Neurochem. 2025. PMID: 40454774 Free PMC article. Review.
References
-
- Weuve J, Kang JH, Manson JE, Breteler MM, Ware JH, et al. (2004) Physical activity, including walking, and cognitive function in older women. JAMA 292: 1454–1461. - PubMed
-
- Hillman CH, Erickson KI, Kramer AF (2008) Be smart, exercise your heart: exercise effects on brain and cognition. Nat Rev Neurosci 9: 58–65. - PubMed
-
- Colcombe S, Kramer AF (2003) Fitness effects on the cognitive function of older adults: a meta-analytic study. Psychol Sci 14: 125–130. - PubMed
-
- Heyn P, Abreu BC, Ottenbacher KJ (2004) The effects of exercise training on elderly persons with cognitive impairment and dementia: a meta-analysis. Arch Phys Med Rehabil 85: 1694–1704. - PubMed
-
- Cotman CW, Berchtold NC (2002) Exercise: a behavioral intervention to enhance brain health and plasticity. Trends Neurosci 25: 295–301. - PubMed
Publication types
MeSH terms
Substances
Grants and funding
- 5R25GM061151/GM/NIGMS NIH HHS/United States
- R25 NS080687/NS/NINDS NIH HHS/United States
- SC1 MH086072/MH/NIMH NIH HHS/United States
- P20 GM103475/GM/NIGMS NIH HHS/United States
- 8R25NS080687/NS/NINDS NIH HHS/United States
- NIH-NIGMS/P20RR016470/RR/NCRR NIH HHS/United States
- P20GM103475/GM/NIGMS NIH HHS/United States
- SC1 GM084708/GM/NIGMS NIH HHS/United States
- R25 GM061151/GM/NIGMS NIH HHS/United States
- P20 RR016470/RR/NCRR NIH HHS/United States
- SC1GM084708/GM/NIGMS NIH HHS/United States
- NIH-NIGMS & 5SC1MH086072/MH/NIMH NIH HHS/United States
LinkOut - more resources
Full Text Sources
Other Literature Sources
Miscellaneous

