

Disruption of Smad4 expression in T cells leads to IgA nephropathy-like manifestations
- PMID: 24223846
- PMCID: PMC3817077
- DOI: 10.1371/journal.pone.0078736
Disruption of Smad4 expression in T cells leads to IgA nephropathy-like manifestations
Abstract
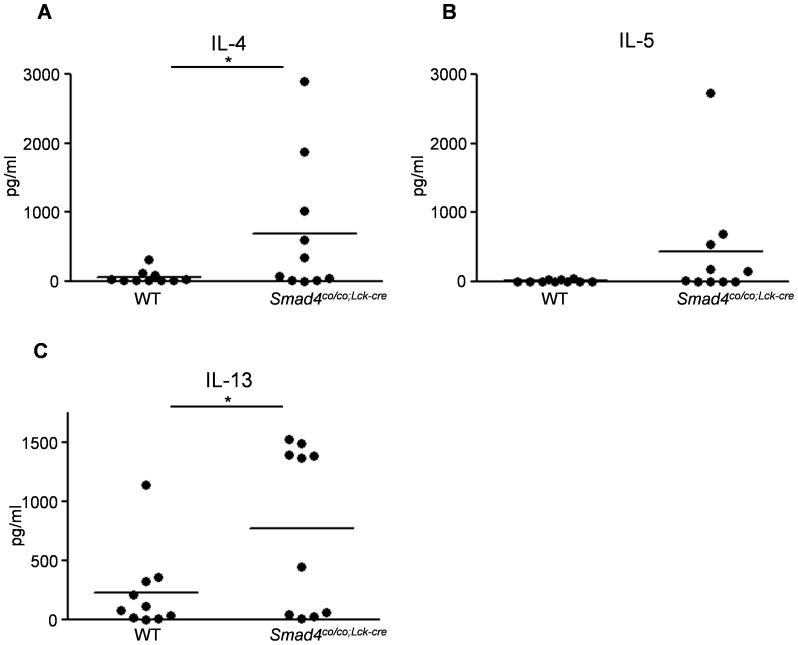
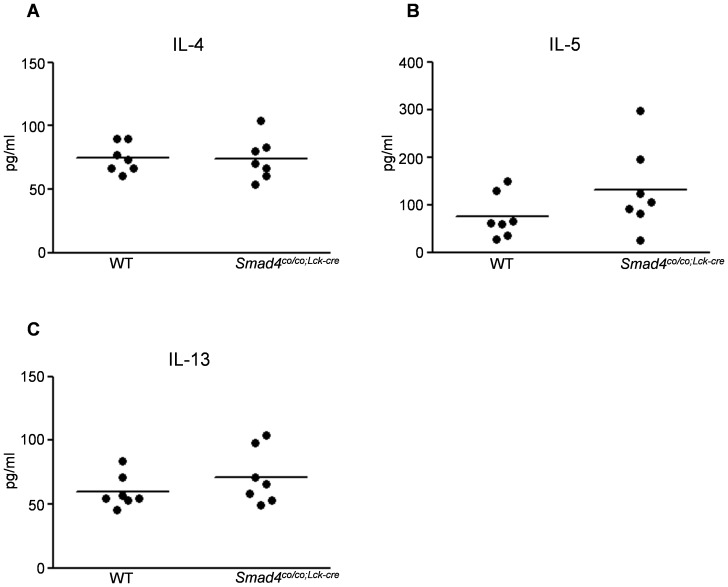
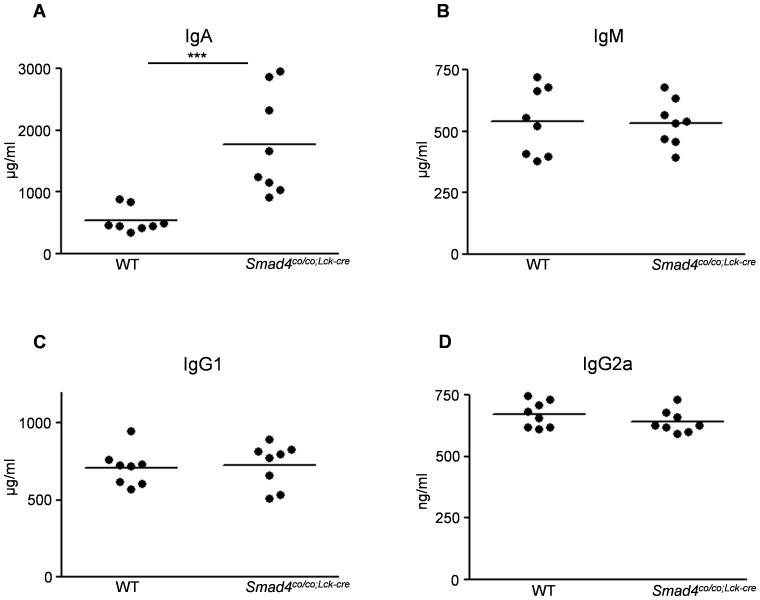
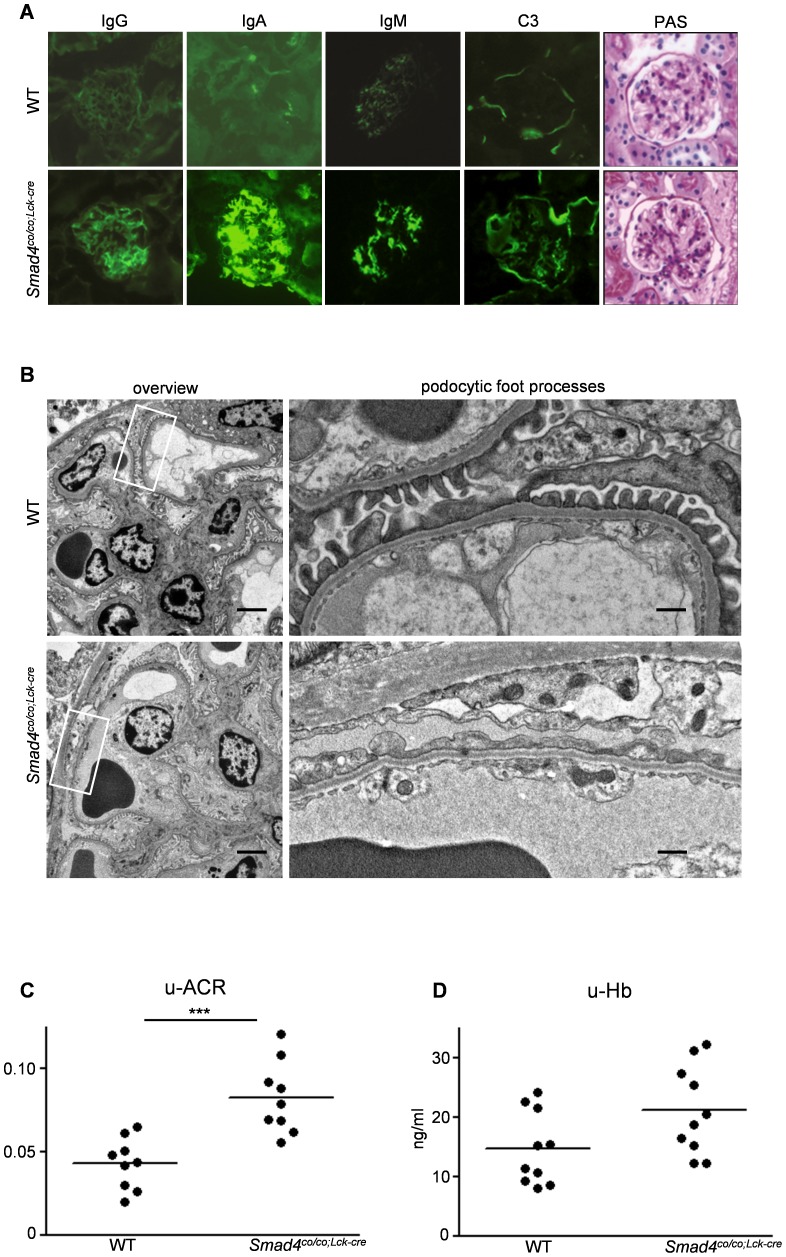
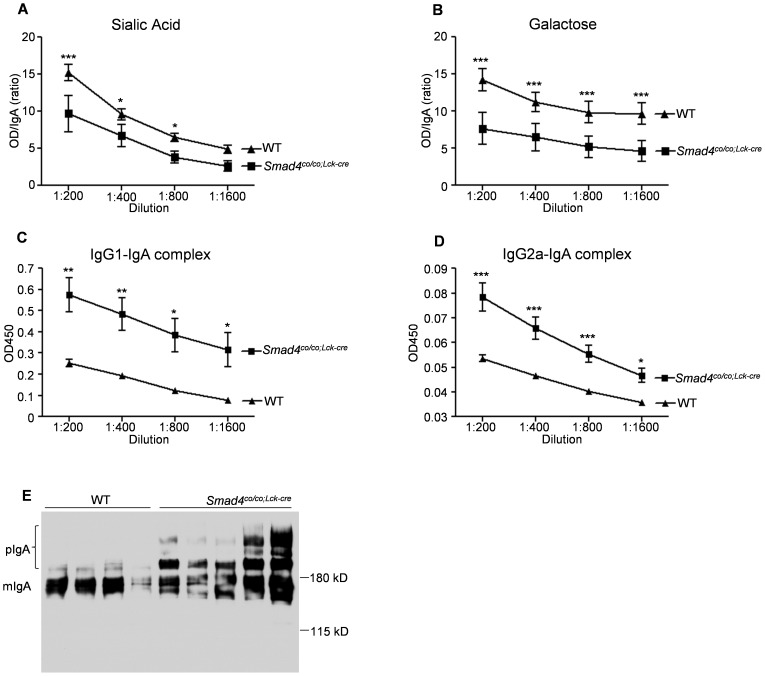
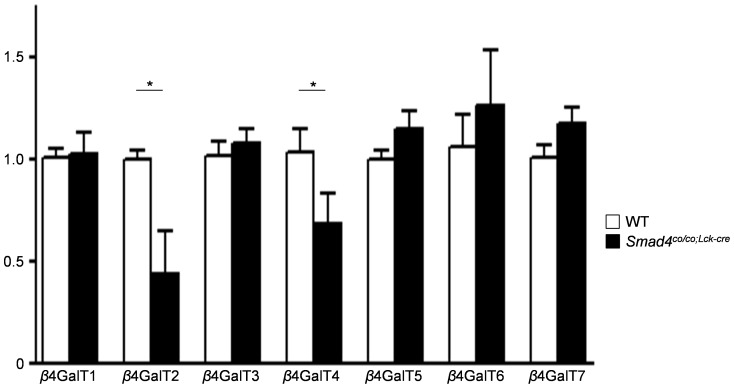
The link between glomerular IgA nephropathy (IgAN) and T helper 2 (Th2) response has been implicated, however, the mechanisms are poorly defined because of the lack of an appropriate model. Here we report a novel murine model characterized by lineage-restricted deletion of the gene encoding MAD homologue 4 (Smad4) in T cells (Smad4(co/co;Lck-cre) ). Loss of Smad4 expression in T cells results in overproduction of Th2 cytokines and high serum IgA levels. We found that Smad4(co/co;Lck-cre) mice exhibited massive glomerular IgA deposition, increased albumin creatinine ratio, aberrant glycosylated IgA, IgA complexed with IgG1 and IgG2a, and polymeric IgA, all known features of IgAN in humans. Furthermore, we examined the β1, 4-galactosyltransferases (β4GalT) enzyme which is involved in the synthesis of glycosylated murine IgA, and we found reduced β4GalT2 and β4GalT4 mRNA levels in B cells. These findings indicate that Smad4(co/co;Lck-cre) mice could be a useful model for studying the mechanisms between IgAN and Th2 response, and further, disruption of Smad4-dependent signaling in T cells may play an important role in the pathogenesis of human IgAN and contributing to a Th2 T cell phenotype.
Conflict of interest statement
Figures
Similar articles
-
MicroRNA-23b-3p Deletion Induces an IgA Nephropathy-like Disease Associated with Dysregulated Mucosal IgA Synthesis.J Am Soc Nephrol. 2021 Oct;32(10):2561-2578. doi: 10.1681/ASN.2021010133. Epub 2021 Sep 3. J Am Soc Nephrol. 2021. PMID: 34479967 Free PMC article.
-
Rapid deposition of glomerular IgA in BALB/c mice by nivalenol and its modifying effect on high IgA strain (HIGA) mice.Exp Toxicol Pathol. 2011 Jan;63(1-2):17-24. doi: 10.1016/j.etp.2009.09.002. Epub 2009 Sep 27. Exp Toxicol Pathol. 2011. PMID: 19783131
-
Dietary zinc is a key environmental modifier in the progression of IgA nephropathy.PLoS One. 2014 Feb 28;9(2):e90558. doi: 10.1371/journal.pone.0090558. eCollection 2014. PLoS One. 2014. PMID: 24587392 Free PMC article.
-
Insight into the physiological function(s) of uteroglobin by gene-knockout and antisense-transgenic approaches.Ann N Y Acad Sci. 2000;923:210-33. doi: 10.1111/j.1749-6632.2000.tb05532.x. Ann N Y Acad Sci. 2000. PMID: 11193759 Review.
-
Molecular basis of IgA nephropathy.Curr Mol Med. 2005 Aug;5(5):475-87. doi: 10.2174/1566524054553450. Curr Mol Med. 2005. PMID: 16101476 Review.
Cited by
-
T lymphocytes in IgA nephropathy.Exp Ther Med. 2020 Jul;20(1):186-194. doi: 10.3892/etm.2020.8673. Epub 2020 Apr 22. Exp Ther Med. 2020. PMID: 32509008 Free PMC article.
-
Henoch-Schönlein purpura nephritis in children.Nat Rev Nephrol. 2014 Oct;10(10):563-73. doi: 10.1038/nrneph.2014.126. Epub 2014 Jul 29. Nat Rev Nephrol. 2014. PMID: 25072122 Review.
-
Serum soluble interleukin-2 receptor alpha may predict tubulointerstitial inflammatory cell infiltration and short-term disease progression in immunoglobin A nephropathy.Immunol Res. 2024 Dec;72(6):1350-1364. doi: 10.1007/s12026-024-09533-1. Epub 2024 Sep 14. Immunol Res. 2024. PMID: 39276201 Free PMC article.
-
Pathogenic T-Cell Responses in Immune-Mediated Glomerulonephritis.Cells. 2022 May 12;11(10):1625. doi: 10.3390/cells11101625. Cells. 2022. PMID: 35626662 Free PMC article. Review.
-
Sequential administration of paricalcitol followed by IL-17 blockade for progressive refractory IgA nephropathy patients.Sci Rep. 2024 Feb 28;14(1):4866. doi: 10.1038/s41598-024-55425-7. Sci Rep. 2024. PMID: 38418932 Free PMC article.
References
-
- van Es LA, van den Wall Bake AW, Valentijn RM, Daha MR (1988) Composition of IgA-containing circulating immune complexes in IgA nephropathy. Am J Kidney Dis 12: 397–401. - PubMed
-
- Couser WG (1999) Glomerulonephritis. Lancet 353: 1509–1515. - PubMed
-
- Hiki Y, Odani H, Takahashi M, Yasuda Y, Nishimoto A, et al. (2001) Mass spectrometry proves under-O-glycosylation of glomerular IgA1 in IgA nephropathy. Kidney Int 59: 1077–1085. - PubMed
-
- Barratt J, Smith AC, Molyneux K, Feehally J (2007) Immunopathogenesis of IgAN. Semin Immunopathol 29: 427–443. - PubMed
-
- Johnson RJ, Hurtado A, Merszei J, Rodriguez-Iturbe B, Feng L (2003) Hypothesis: dysregulation of immunologic balance resulting from hygiene and socioeconomic factors may influence the epidemiology and cause of glomerulonephritis worldwide. Am J Kidney Dis 42: 575–581. - PubMed
Publication types
MeSH terms
Substances
Grants and funding
LinkOut - more resources
Full Text Sources
Other Literature Sources
Molecular Biology Databases
Miscellaneous
