

Incorporating conservation zone effectiveness for protecting biodiversity in marine planning
- PMID: 24223870
- PMCID: PMC3817092
- DOI: 10.1371/journal.pone.0078986
Incorporating conservation zone effectiveness for protecting biodiversity in marine planning
Abstract
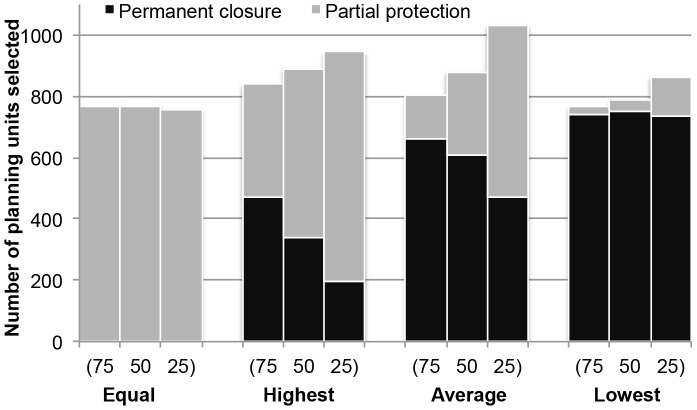
Establishing different types of conservation zones is becoming commonplace. However, spatial prioritization methods that can accommodate multiple zones are poorly understood in theory and application. It is typically assumed that management regulations across zones have differential levels of effectiveness ("zone effectiveness") for biodiversity protection, but the influence of zone effectiveness on achieving conservation targets has not yet been explored. Here, we consider the zone effectiveness of three zones: permanent closure, partial protection, and open, for planning for the protection of five different marine habitats in the Vatu-i-Ra Seascape, Fiji. We explore the impact of differential zone effectiveness on the location and costs of conservation priorities. We assume that permanent closure zones are fully effective at protecting all habitats, open zones do not contribute towards the conservation targets and partial protection zones lie between these two extremes. We use four different estimates for zone effectiveness and three different estimates for zone cost of the partial protection zone. To enhance the practical utility of the approach, we also explore how much of each traditional fishing ground can remain open for fishing while still achieving conservation targets. Our results show that all of the high priority areas for permanent closure zones would not be a high priority when the zone effectiveness of the partial protection zone is equal to that of permanent closure zones. When differential zone effectiveness and costs are considered, the resulting marine protected area network consequently increases in size, with more area allocated to permanent closure zones to meet conservation targets. By distributing the loss of fishing opportunity equitably among local communities, we find that 84-88% of each traditional fishing ground can be left open while still meeting conservation targets. Finally, we summarize the steps for developing marine zoning that accounts for zone effectiveness.
Conflict of interest statement
Figures


Similar articles
-
Effectiveness of management zones for recovering parrotfish species within the largest coastal marine protected area in Brazil.Sci Rep. 2022 Jul 18;12(1):12232. doi: 10.1038/s41598-022-15990-1. Sci Rep. 2022. PMID: 35851599 Free PMC article.
-
Ocean zoning for conservation, fisheries and marine renewable energy: assessing trade-offs and co-location opportunities.J Environ Manage. 2015 Apr 1;152:201-9. doi: 10.1016/j.jenvman.2015.01.045. Epub 2015 Feb 12. J Environ Manage. 2015. PMID: 25684567
-
Efficient and equitable design of marine protected areas in Fiji through inclusion of stakeholder-specific objectives in conservation planning.Conserv Biol. 2015 Oct;29(5):1378-89. doi: 10.1111/cobi.12514. Epub 2015 Apr 27. Conserv Biol. 2015. PMID: 25916976
-
New perspectives on sea use management: initial findings from European experience with marine spatial planning.J Environ Manage. 2009 Jan;90(1):77-88. doi: 10.1016/j.jenvman.2008.07.004. Epub 2008 Sep 10. J Environ Manage. 2009. PMID: 18786758 Review.
-
Marine nature conservation and conflicts with fisheries.Ambio. 2020 Jul;49(7):1328-1340. doi: 10.1007/s13280-019-01279-7. Epub 2019 Nov 20. Ambio. 2020. PMID: 31749103 Free PMC article. Review.
Cited by
-
Ecosystem services and opportunity costs shift spatial priorities for conserving forest biodiversity.PLoS One. 2014 Nov 13;9(11):e112557. doi: 10.1371/journal.pone.0112557. eCollection 2014. PLoS One. 2014. PMID: 25393951 Free PMC article.
-
Effectiveness of management zones for recovering parrotfish species within the largest coastal marine protected area in Brazil.Sci Rep. 2022 Jul 18;12(1):12232. doi: 10.1038/s41598-022-15990-1. Sci Rep. 2022. PMID: 35851599 Free PMC article.
-
The crowded sea: incorporating multiple marine activities in conservation plans can significantly alter spatial priorities.PLoS One. 2014 Aug 7;9(8):e104489. doi: 10.1371/journal.pone.0104489. eCollection 2014. PLoS One. 2014. PMID: 25102177 Free PMC article.
-
Scoping Recreational Disturbance of Shorebirds to Inform the Agenda for Research and Management in Tropical Asia.Trop Life Sci Res. 2020 Jul;31(2):51-78. doi: 10.21315/tlsr2020.31.2.4. Epub 2020 Aug 6. Trop Life Sci Res. 2020. PMID: 32922669 Free PMC article.
References
-
- Crowder LB, Osherenko G, Young OR, Airamé S, Norse EA, et al. (2006) Resolving mismatches in U.S. ocean governance. Science 313: 617–618. - PubMed
-
- Day JC (2002) Zoning—lessons from the Great Barrier Reef Marine Park. Ocean Coast Manag 45: 139–156.
-
- Douvere F (2008) The importance of marine spatial planning in advancing ecosystem-based sea use management. Marine Policy 32: 762–771.
-
- Brown K, Adger WN, Tompkins E, Bacon P, Shim D, et al. (2001) Trade-off analysis for marine protected area management. Ecol Econ 37: 417–434.
Publication types
MeSH terms
LinkOut - more resources
Full Text Sources
Other Literature Sources
