. 2013 Nov 1;8(11):e79102.
doi: 10.1371/journal.pone.0079102. eCollection 2013.

Recycling of the high valence States of heme proteins by cysteine residues of THIMET-oligopeptidase

Affiliations

Recycling of the high valence States of heme proteins by cysteine residues of THIMET-oligopeptidase

Juliana C Ferreira et al. PLoS One. .

Abstract

The peptidolytic enzyme THIMET-oligopeptidase (TOP) is able to act as a reducing agent in the peroxidase cycle of myoglobin (Mb) and horseradish peroxidase (HRP). The TOP-promoted recycling of the high valence states of the peroxidases to the respective resting form was accompanied by a significant decrease in the thiol content of the peptidolytic enzyme. EPR (electron paramagnetic resonance) analysis using DBNBS spin trapping revealed that TOP also prevented the formation of tryptophanyl radical in Mb challenged by H2O2. The oxidation of TOP thiol groups by peroxidases did not promote the inactivating oligomerization observed in the oxidation promoted by the enzyme aging. These findings are discussed towards a possible occurrence of these reactions in cells.


Conflict of interest statement

Competing Interests: The authors have declared that no competing interests exist.

Figures

Figure 1
Figure 1. Catalytic cycle of Mb.
A) Absence of TOP. Electronic absorption spectra of 0.5 µM Mb before (thin solid line),10 min (gray line) and 120 min (thick solid line) after the addition of 5 µM H2O2. B) Presence of TOP. Electronic absorption spectra of 0.5 µM Mb before (thin solid line),10 min (gray line) and 35 min (thick solid line) after the addition of 5 µM H2O2. C) Effect of TOP concentration on the rate of Mb Compound II recycling to the resting form. After normalization of the spectra of Mb Compound II and recycled Mb by the maximal intensity of Soret band, the rate of oxoferryl Mb recycling to the resting state was calculated by the difference of intensity at 408 nm and the normalized spectra of the recycled Mb. The delta normalized absorbance at 408 nm was divided by the time of recycling and plotted as a function of TOP concentration. Different TOP concentrations were added 10 min after hydrogen peroxide addition (maximal Soret band red shift). Immediately after the formation of Compound II, 5 µM of TOP was added to the medium. These results are representative of a set of two independent experiments with standard deviation of 15%. The reaction was carried out at 37 °C, in 20 mM Tris buffer pH 7.4 treated with Chelex-100®.
Figure 2
Figure 2. Catalytic cycle of HRP in the presence of TOP.
UV-vis spectrum of 0.5 µM HRP before (thin solid line) 10 min (dotted line) and 17 min (thick solid line) after the addition of 5 µM H202. Immediately after the formation of Compound II, 5 µM of TOP was added to the medium. The reaction was carried out at 37 °C, in 20 mM Tris buffer pH 7.4 treated with Chelex-100 ®.
Figure 3
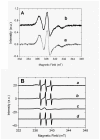
Figure 3. EPR spectra of Mb.
A) Absence of TOP. Line a = 5 µM Fe3+Mb, lines b, c and d are the respective EPR spectra obtained immediately, 30 min, and 180 min after the addition of 50 µM H202. B) Presence of 20 µM TOP: Line a = 5 µM Fe3+Mb, lines b, c, d and e are the respective EPR spectra obtained immediately, 30, 60, and 90 min after the addition of 50 µM H2O2. The expanded field view shows the signal of a free radical signal overlapped on the g2 component of EPR spectrum of heme iron obtained 30 min after the addition of H2O2. When present, TOP was previously treated with 1 mM TCEP. The concentration of DMPO = 20 mM. EPR conditions were: microwave frequency = 9.47177 GHz, central field, 240 mT, scanning field, 400 mT, number of points, 2048, modulation amplitude, 1 mT, gain, 45 dB, temperature, 4.30 K, time constant, 20.5 ms, conversion time, 81.9 ms, microwave power, 5 mW. The reactions were carried out in 20 mM Tris buffer pH 7.4 treated with Chelex-100®.
Figure 4
Figure 4. Experimental EPR spectra of tryptophanyl DBNBS adducts obtained from the reaction mixture containing Mb and H2O2.
A) Absence of TOP. Line a and b correspond, respectively, to the EPR spectra of 20 mM DBNBS adduct obtained immediately and 10 min after the addition of 50 µM H2O2 to 5 µM Fe3+Mb solution. The light gray line, overlapped on line a, corresponds to the spectrum simulated by NLS software, B) Presence of 20 µM TOP: Lines a, b, c and d correspond to the experimental EPR spectrum, simulated composite EPR spectrum, and the simulated rigid and free rotating components, respectively. The spectrum was obtained immediately after the addition of 50 µM H2O2 in 5 µM Fe3+Mb solution. When present, TOP was previously treated with 1 mM TCEP. EPR conditions were: microwave frequency = 9.5077 GHz, central field, 340 mT, scanning field, 16 mT, number of points, 1024, modulation amplitude, 0.05 mT, gain, 5.0x10⁵, temperature, 293 K, time constant, 0.128 s, scan time, 300 s, microwave power, 20 mW. The reaction was performed in buffer Tris 20 mM previously treated with Chelex-100 ®, pH 7.4, at 25° C.
Figure 5
Figure 5. Maldi-ToF mass spectra of Mb incubated at different conditions: absence of H2O2.
(A), the products of a 10 min reaction with H2O2, in the presence of 10 mM DBNBS obtained in the absence (B) and in the presence (C) of TOP. Reactions were carried out in 20 mM tris buffer pH 7.4.
Figure 6
Figure 6. SH content and aggregates of TOP treated with 10 mM (100% reduced cysteines) and 1 mM (40% reduced cysteines) TCEP.
A) WT) wild type TOP, A) + 10 mM TCEP, B) + 10 mM TCEP and 5 µM H2O2, C) + 10 mM TCEP and 0.5 µM Mb, D) + 10 mM TCEP and 0.5 µM Mb and 5 µM H2O2, E) + 10 mM TCEP and 0.5 µM HRP, F) + 10 mM TCEP and 0.5 µM HRP and 5 µM H2O2, A') + 1 mM TCEP, B') + 1 mM TCEP and 5 µM H2O2, C') + 1 mM TCEP and 0.5 µM Mb, D') + 1 mM TCEP and 0.5 µM Mb and 5 µM H2O2, E') + 1 mM TCEP and 0.5 µM HRP, F') + 1 mM TCEP and 0.5 µM HRP and 5 µM H2O2. B) SDS-PAGE of TOP at the following conditions: lanes 1 to 7 correspond, respectively, to molecular weight standard, 100% reduced TOP, + H2O2, + Mb, + H2O2, and Mb, + HRP, + HRP and H2O2. C) SDS-PAGE of 40%-reduced TOP at the following conditions: lanes 1 to 7 correspond, respectively, to molecular weight standard, 40% reduced TOP, + H2O2, + Mb, + H2O2, and Mb, + HRP, + HRP and H2O2. D) This panel shows the large amount of aggregates in aged TOP. The reaction mixtures were incubated for 2 hours in buffer Tris 20 mM Chelex-100 ®, pH 7.4, at 37° and contained 5 µM TOP. The SDS-PAGE of 100% reduced TOP was done with 10 μM TOP.
Figure 7
Figure 7. Mechanism of TOP oxidation by hydrogen peroxide.
Figure 8
Figure 8. Redox cycle of myoglobin.
Ferric Mb reacts with hydrogen peroxide to give the long-lived oxoferryl species and a transient protein radical (tryptophanyl radical), directly formed or resulting from electron transfer from the protein to the porphyrin π cation radical (steps a and b). The long-lived oxoferryl Mb can recycle to the resting form by two electron reduction (step c). Tryptophanyl free radical could react with molecular oxygen to form a peroxyl-derived free radical (step d). The protein radical may lead to the Mb degradation (bleaching) as shown in step e.
Figure 9
Figure 9. Proposed mechanism of TOP participation in the redox cycling of myoglobin.
In the presence of TOP, steps a and b also occurs and the Mb “Compound I” is recycled to the resting form by using TOP thiol groups as a reducing agent (steps c and d).
Figure 10
Figure 10. Production of TOP thiyl radical by Mb.
The Mb-catalized one-electron oxidation of TOP is expected to generate thiyl free radical and the fate of this free radical is proposed according to reference 55.

Similar articles

Cited by

References

    1. Barrett AJ, Brown MA, Dando PM, Knight CG, McKie N et al. (1995) Thimet oligopeptidase and oligopeptidase M or neurolysin. Methods Enzymol 248: 529-556. PubMed: 7674943. - PubMed
    1. Camargo AC, Gomes MD, Reichl AP, Ferro ES, Jacchieri S et al. (1997) Structural features that make oligopeptides susceptible substrates for hydrolysis by recombinant thimet oligopeptidase. Biochem J 324: 517-522. PubMed: 9182712. - PMC - PubMed
    1. Oliveira V, Campos M, Melo RL, Ferro ES, Camargo AC et al. (2001) Substrate specificity characterization of recombinant metallo oligopeptidases thimet oligopeptidase and neurolysin. Biochemistry 40: 4417-4425. PubMed: 11284698. - PubMed
    1. Orlowski M, Michaud C, Chu TG (1983) A soluble metalloendopeptidase from rat brain. Purification of the enzyme and determination of specificity with synthetic and natural peptides. Eur J Biochem 135: 81-88. PubMed: 6349998, . - PubMed
    1. Camargo AC, Oliveira EB, Toffoletto O, Metters KM, Rossier J (1987) Brain endooligopeptidase A, a putative enkephalin converting enzyme. J Neurochem 48: 1258- 1263. PubMed: 2880931. - PubMed

Publication types

MeSH terms

LinkOut - more resources