. 2013 Nov 1;8(11):e79679.
doi: 10.1371/journal.pone.0079679. eCollection 2013.

N-cadherin relocalizes from the periphery to the center of the synapse after transient synaptic stimulation in hippocampal neurons

Affiliations

N-cadherin relocalizes from the periphery to the center of the synapse after transient synaptic stimulation in hippocampal neurons

Patricia T Yam et al. PLoS One. .

Abstract

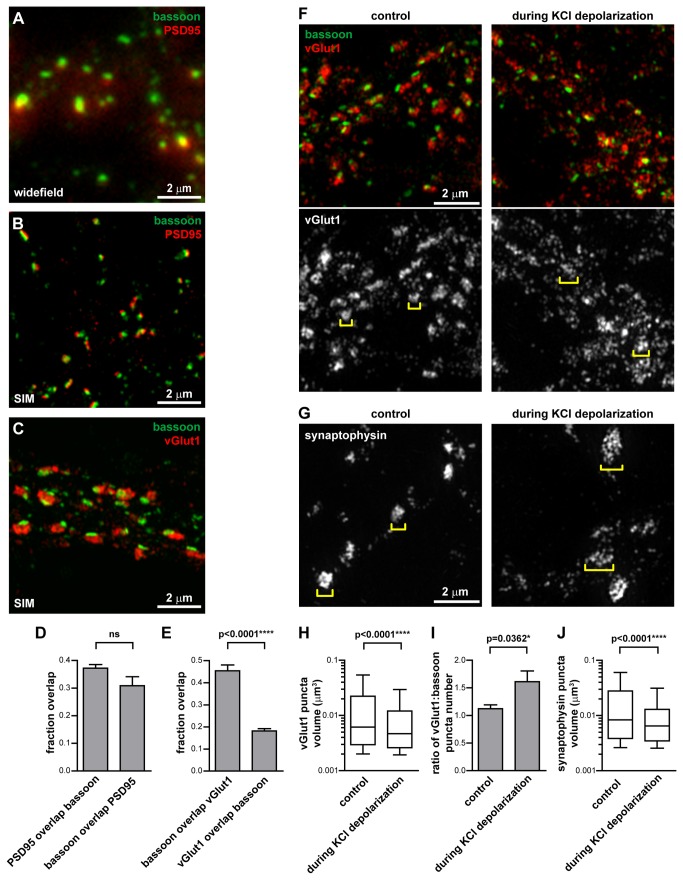
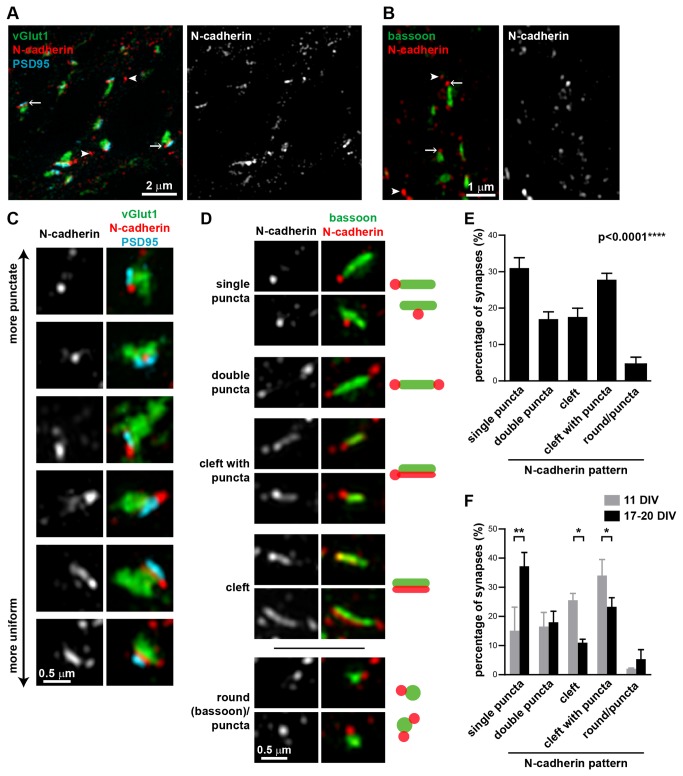
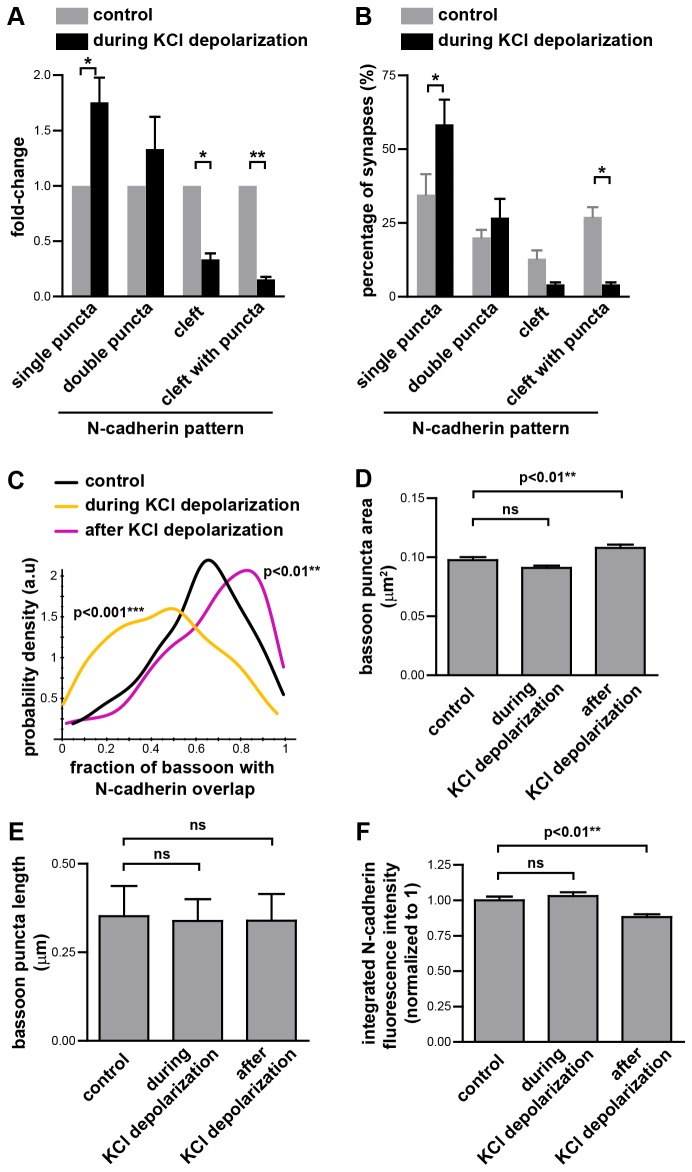
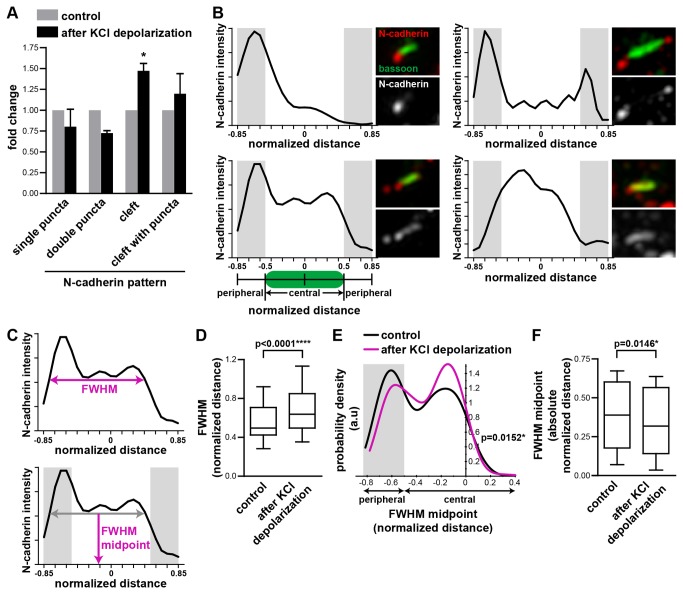
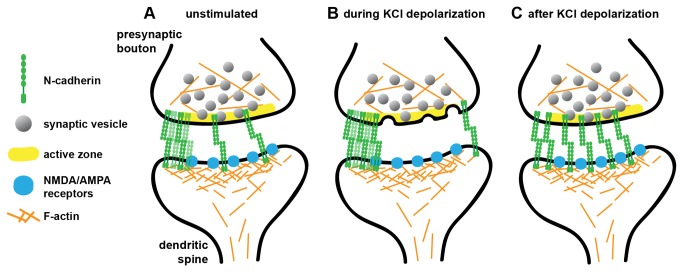
N-cadherin is a cell adhesion molecule which is enriched at synapses. Binding of N-cadherin molecules to each other across the synaptic cleft has been postulated to stabilize adhesion between the presynaptic bouton and the postsynaptic terminal. N-cadherin is also required for activity-induced changes at synapses, including hippocampal long term potentiation and activity-induced spine expansion and stabilization. We hypothesized that these activity-dependent changes might involve changes in N-cadherin localization within synapses. To determine whether synaptic activity changes the localization of N-cadherin, we used structured illumination microscopy, a super-resolution approach which overcomes the conventional resolution limits of light microscopy, to visualize the localization of N-cadherin within synapses of hippocampal neurons. We found that synaptic N-cadherin exhibits a spectrum of localization patterns, ranging from puncta at the periphery of the synapse adjacent to the active zone to an even distribution along the synaptic cleft. Furthermore, the N-cadherin localization pattern within synapses changes during KCl depolarization and after transient synaptic stimulation. During KCl depolarization, N-cadherin relocalizes away from the central region of the synaptic cleft to the periphery of the synapse. In contrast, after transient synaptic stimulation with KCl followed by a period of rest in normal media, fewer synapses have N-cadherin present as puncta at the periphery and more synapses have N-cadherin present more centrally and uniformly along the synapse compared to unstimulated cells. This indicates that transient synaptic stimulation modulates N-cadherin localization within the synapse. These results bring new information to the structural organization and activity-induced changes occurring at synapses, and suggest that N-cadherin relocalization may contribute to activity dependent changes at synapses.


Conflict of interest statement

Competing Interests: The authors declare that they received funding from Rio Tinto Alcan, and that this does not alter their adherence to all the PLOS ONE policies on sharing data and materials.

Figures

Figure 1
Figure 1. Structured illumination microscopy can resolve different synaptic domains.
(A,B) 17-20 DIV hippocampal neurons immunostained for the active zone protein bassoon and the post-synaptic density protein PSD95, or (C) bassoon and the synaptic vesicle protein vGlut1. (A) Imaged with widefield fluorescence microscopy, bassoon and PSD95 puncta overlap. (B) Imaged with SIM, the increased resolution shows that bassoon and PSD95 occupy separate domains, consistent with their function in the pre- and post-synaptic compartments respectively. (C) Within the presynaptic bouton, the synaptic vesicle pool (represented by vGlut1) and the active zone (represented by bassoon) can be distinguished with SIM. (D) Manders’ coefficient measurement of the proportion of PSD95 signal which overlaps with the bassoon signal and vice versa. Unpaired t-test, 6 fields of view. (E) Manders’ coefficient measurement of the proportion of bassoon signal which overlaps with the vGlut1 signal and vice versa. Unpaired t-test, 6 fields of view. Graphs represent the mean ± s.e.m. (F,G) During depolarization of neurons with 50 mM KCl, the synaptic vesicle markers vGlut1 and synaptophysin become smaller and more numerous, and spread over larger area (brackets). (H) The vGlut1 puncta volume decreases during KCl depolarization. Box and whiskers graph. Mann Whitney test, 7 fields of view, ≥980 vGlut1 puncta analyzed per condition. (I) The number of vGlut1 puncta per bassoon puncta increases during KCl depolarization. Graph represents the mean ± s.e.m. Unpaired t-test, 7 fields of view, ≥874 bassoon puncta analyzed per condition. (J) The synaptophysin puncta volume decreases during KCl depolarization. Box and whiskers graph. Mann Whitney test, ≥10 fields of view per condition, ≥533 synaptophysin puncta analyzed per condition.
Figure 2
Figure 2. N-cadherin has a spectrum of localization patterns at the synaptic cleft.
(A) N-cadherin is localized between the pre- and post-synaptic compartments, represented by vGlut1 and PSD95 respectively. (B) N-cadherin is localized at or adjacent to the active zone, represented by bassoon. Arrows, N-cadherin puncta associated with synapses; arrowheads, N-cadherin puncta not associated with synapses. (C) N-cadherin localization at synapses varies from punctate, often flanking one side of the synapse, to uniform along the synaptic cleft. (D) Classification of N-cadherin localization patterns relative to bassoon into five categories (single puncta, double puncta, cleft with puncta, cleft, and round(bassoon)/puncta). Representative images and schematics of the five different N-cadherin localization patterns. (E) Percentage of synapses (mean±s.e.m) in 17-20 DIV hippocampal neurons in each N-cadherin pattern category. n=7 experiments, ≥77 synapses per experiment, 650 synapses total. p<0.0001, one-way ANOVA, Tukey’s post-test (p<0.01 for single puncta vs. double puncta; p<0.01 for single puncta vs. cleft; p>0.05 for single puncta vs. cleft with puncta; p<0.001 for single puncta vs. round/puncta). (F) Percentage of synapses (mean±s.e.m) in each N-cadherin pattern category in 11 DIV hippocampal neurons compared to matched cultures at 17-20 DIV. N-cadherin at synapses from neurons at 11 DIV is distributed more evenly along the synaptic cleft and less as puncta compared to synapses from neurons at 17-20 DIV. Two-way ANOVA with matched values and Bonferroni post-test. n=2 experiments, ≥103 synapses per experiment.
Figure 3
Figure 3. N-cadherin localization changes during and after KCl depolarization.
(A,B) During depolarization with 30-50 mM KCl, the proportion of synapses with N-cadherin puncta adjacent to the active zone increases, whereas the proportion of synapses with N-cadherin along the synaptic cleft decreases. n=3 experiments, ≥88 synapses per experiment, total of 315 synapses (178 and 137 synapses for the control and during KCl stimulation conditions respectively). * = p<0.05, ** = p<0.01, two-way ANOVA with matched values and Bonferroni post-test. Graphs represent the mean ± s.e.m. (C) Colocalization of N-cadherin with bassoon was measured by the fraction of each bassoon puncta that overlapped with N-cadherin. The probability density function for the distribution of the values for the fraction of each bassoon puncta which overlaps with N-cadherin shows that during KCl depolarization less N-cadherin colocalizes with bassoon, whereas 15 min after transient exposure to KCl, more N-cadherin colocalizes with bassoon. Kruskal-Wallis test, Dunn’s post-test. n=3 experiments, ≥212 synapses per experiment. (D) The area (mean ± s.e.m) of each bassoon puncta during and 15 min after transient KCl depolarization. One-way ANOVA, Dunnett’s post-test. n=3 experiments, n≥220 synapses per experiment, 1133 synapses total. (E) The length of each bassoon puncta during and 15 min after transient KCl depolarization. Graph represents the median and interquartile range. Kruskal-Wallis test, p =0.1213. n=3 experiments, n≥314 synapses per experiment, 1054 synapses total. (F) The integrated N-cadherin fluorescence intensity of N-cadherin at each synapse was measured and normalized to the mean value of the control synapses in their respective experiment. Graph represents the mean ± s.e.m. One-way ANOVA, Dunnett’s post-test. n=3 experiments, n≥214 synapses per experiment, 1037 synapses total.
Figure 4
Figure 4. Transient synaptic stimulation relocalizes N-cadherin from the periphery to the center of the synapse.
(A) Transient KCl depolarization followed by a rest of 15 min reduced the proportion of synapses with punctate N-cadherin adjacent to the active zone and increased the proportion of synapses with N-cadherin along the synaptic cleft. n=3 experiments, ≥120 synapses per experiment. * = p<0.05, two-way ANOVA. (B) Example linescans of N-cadherin fluorescence intensity along the synaptic cleft. Corresponding images are on the right of each linescan. Linescans extended beyond both ends of the active zone as delineated by the bassoon rods, and were normalised to the length of the bassoon rods. The central region was defined as the region occupied by bassoon. The peripheral region was immediately adjacent to this (shaded in gray). (C) Definition of the full-width at half-maximum (FWHM) and FWHM midpoint. (D) Box and whiskers graph of the FWHM distribution. Transient KCl depolarization increased the FWHM of the N-cadherin fluorescence peak. n≥339 synapses per condition. Mann Whitney test. (E) The probability density function for the distribution of the FWHM midpoint values. Transient KCl depolarization shifted the FWHM midpoint of the N-cadherin fluorescence peak from a peripheral to a central synaptic location. n≥339 synapses per condition. Mann Whitney test. (F) Box and whiskers graph of the absolute value of the FWHM midpoint. After transient KCl depolarization, the absolute FWHM midpoint decreased, indicating a shift towards the center of the synapse. n=3 experiments, n≥214 synapses per experiment. Mann Whitney test.
Figure 5
Figure 5. N-cadherin relocalizes to the center of the synapse after transient synaptic stimulation.
(A) In unstimulated neurons, N-cadherin is present at synapses in a variety of distributions. It is primarily found as puncta near the edges of the active zone, but can also be present as a more uniform distribution along the synaptic cleft. (B) During KCl depolarization, there is less N-cadherin in the central region along the active zone, and more N-cadherin at periphery of the active zone. (C) After transient synaptic stimulation with KCl, N-cadherin relocalizes to form a broader central distribution along the active zone. This change in N-cadherin localization may have consequences for the increase in synaptic strength and stability following synaptic activity.

References

    1. Redies C (2000) Cadherins in the central nervous system. Prog Neurobiol 61: 611–648. doi:10.1016/S0301-0082(99)00070-2. PubMed: 10775799. - DOI - PubMed
    1. Takeichi M (2007) The cadherin superfamily in neuronal connections and interactions. Nat Rev Neurosci 8: 11–20. doi:10.1038/nrn2043. PubMed: 17133224. - DOI - PubMed
    1. Brasch J, Harrison OJ, Honig B, Shapiro L (2012) Thinking outside the cell: how cadherins drive adhesion. Trends Cell Biol 22: 299–310. doi:10.1016/j.tcb.2012.03.004. PubMed: 22555008. - DOI - PMC - PubMed
    1. Arikkath J, Reichardt LF (2008) Cadherins and catenins at synapses: roles in synaptogenesis and synaptic plasticity. Trends Neurosci 31: 487–494. doi:10.1016/j.tins.2008.07.001. PubMed: 18684518. - DOI - PMC - PubMed
    1. Benson DL, Tanaka H (1998) N-cadherin redistribution during synaptogenesis in hippocampal neurons. J Neurosci 18: 6892–6904. PubMed: 9712659. - PMC - PubMed

Publication types