. 2013 Nov 5;8(11):e79867.
doi: 10.1371/journal.pone.0079867. eCollection 2013.

Functional role of Mst1/Mst2 in embryonic stem cell differentiation

Affiliations

Functional role of Mst1/Mst2 in embryonic stem cell differentiation

Peng Li et al. PLoS One. .

Abstract

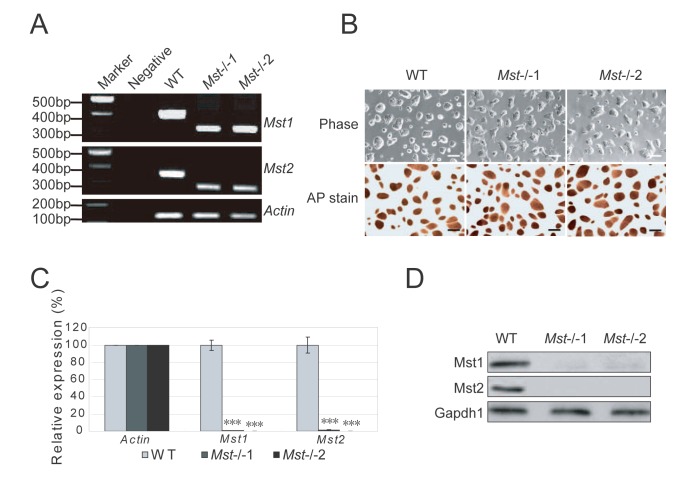
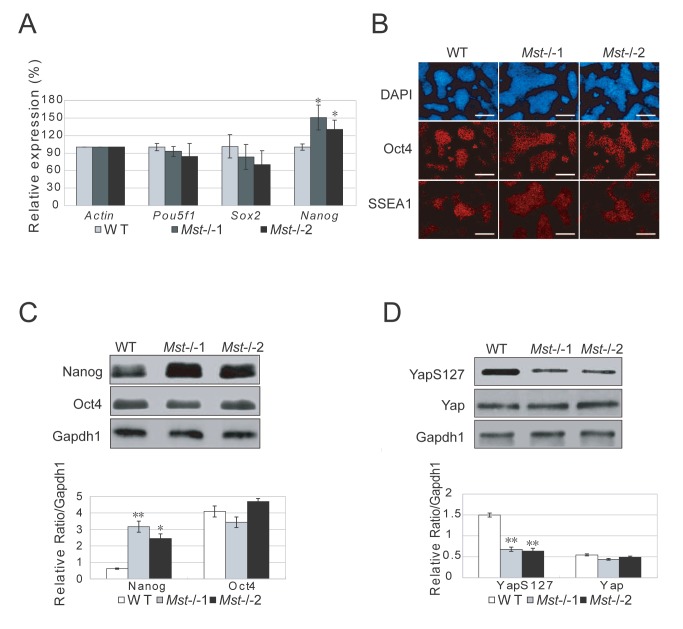
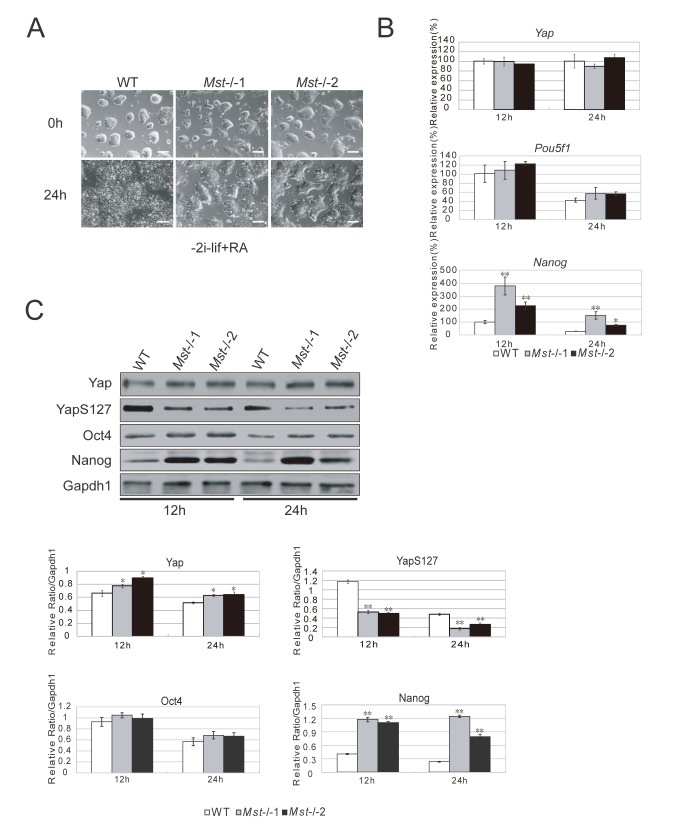
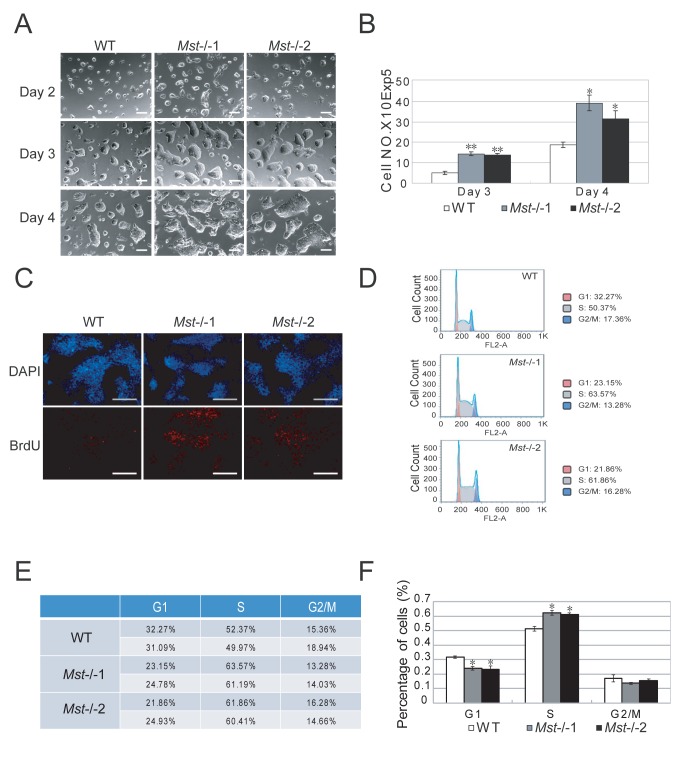
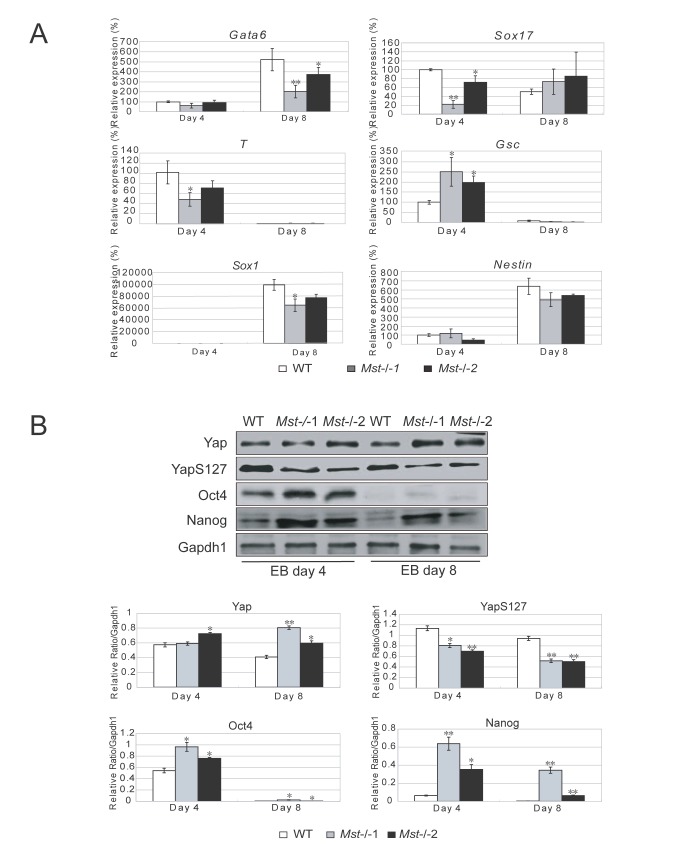
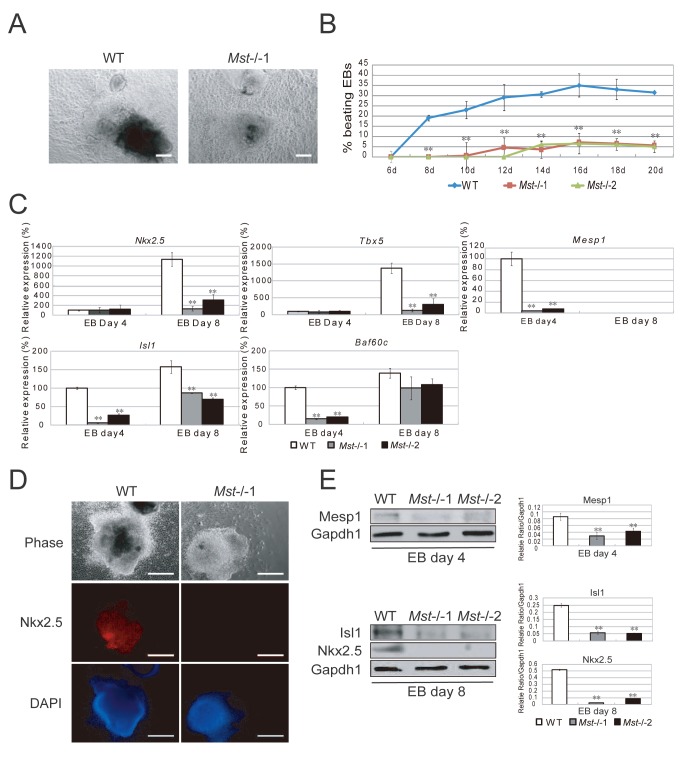
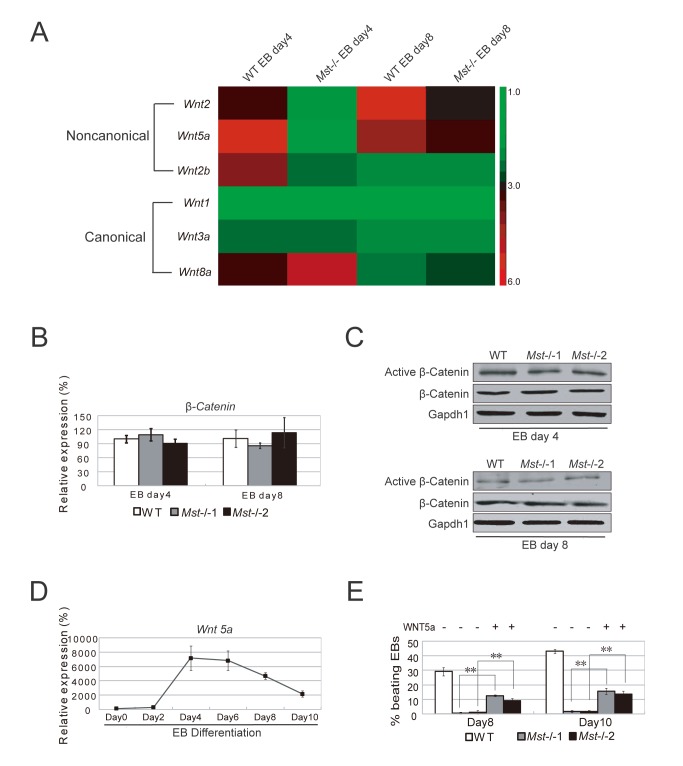
The Hippo pathway is an evolutionary conserved pathway that involves cell proliferation, differentiation, apoptosis and organ size regulation. Mst1 and Mst2 are central components of this pathway that are essential for embryonic development, though their role in controlling embryonic stem cells (ES cells) has yet to be exploited. To further understand the Mst1/Mst2 function in ES cell pluripotency and differentiation, we derived Mst1/Mst2 double knockout (Mst-/-) ES cells to completely perturb Hippo signaling. We found that Mst-/- ES cells express higher level of Nanog than wild type ES cells and show differentiation resistance after LIF withdrawal. They also proliferate faster than wild type ES cells. Although Mst-/- ES cells can form embryoid bodies (EBs), their differentiation into tissues of three germ layers is distorted. Intriguingly, Mst-/- ES cells are unable to form teratoma. Mst-/- ES cells can differentiate into mesoderm lineage, but further differentiation to cardiac lineage cells is significantly affected. Microarray analysis revealed that ligands of non-canonical Wnt signaling, which is critical for cardiac progenitor specification, are significantly repressed in Mst-/- EBs. Taken together our results showed that Mst1/Mst2 are required for proper cardiac lineage cell development and teratoma formation.


Conflict of interest statement

Competing Interests: The authors have declared that no competing interests exist.

Figures

Figure 1
Figure 1. Isolation of Mst-/- ES cells.
(A) Genotyping of wild type (WT) ES cells and Mst-/- ES cells derived from blastocysts by PCR amplification of genomic DNA. Wild type ES cells showed a larger band while Mst-/- ES cells displayed a smaller band. Actin was used as an internal control. (B) Phase contrast microscopy of wild type (WT) and two independent Mst-/- knockout ES cell lines (Mst-/-1 and Mst-/-2) grown on 0.2% gelatin in 2i+LIF medium (Upper). These cells were stained for alkaline phosphatase (Lower). Scale bar, 200 μm. (C) mRNA level of Mst1 and Mst2 in wild type ES cells and Mst-/- ES cells examined by quantitative real-time PCR using primers flanking the deleted region of Mst1 and Mst2. The data are shown as the mean ± S.D (n=3). Actin was normalized as an internal control. Statistically significant differences are indicated (*, P<0.05; **, P<0.01; ***, P<0.001). (D) Immunoblotting analysis of the expression of Mst1 and Mst2 in wild type ES cells and Mst-/- ES cells. Gapdh1 was used as a loading control.
Figure 2
Figure 2. Characterization of Mst-/- ES cells.
(A) Quantitative real-time PCR to examine the mRNA level of pluripotent markers Pou5f1, Sox2 and Nanog in wild type ES cells and Mst-/- knockout ES cells. Actin was analyzed as an internal control. The data are shown as the mean ± S.D (n=3). Statistically significant differences are indicated (*, P<0.05; **, P<0.01; ***, P<0.001). (B) Immunofluorescence staining of the pluripotent protein Oct4 and SSEA1 expression in wild type ES cells and Mst-/- knockout ES cells. Neuclei were stained with DAPI. Scale bar, 200μm. (C) Immunoblotting and densitometric analysis of Nanog and Oct4 in wild type ES cells and Mst-/- ES cells. Gapdh1 was analyzed as an internal control. The data are shown as the mean ± S.D (n=2). Statistically significant differences are indicated (*, P<0.05; **, P<0.01; ***, P<0.001). (D) Immunoblotting and densitometric analysis of the expression of Yap and phosphorylated Yap (YapS127) in wild type ES cells and Mst-/- ES cells. Gapdh1 was analyzed as an internal control. The data are shown as the mean ± S.D (n=2). Statistically significant differences are indicated (*, P<0.05; **, P<0.01; ***, P<0.001).
Figure 3
Figure 3. Differentiation resistance of Mst-/- ES cells.
(A) Morphology of wild type ES cells and Mst-/- ES cells initially and 24 hour after growing in ES cell differentiation medium supplemented with RA, but not 2i and LIF. Scale bar, 200 μm. (B) Quantitative real-time PCR to examine the mRNA level of Yap, Pou5f1 and Nanog in wild type ES cells and Mst-/- ES cells during ES cell differentiation medium for 12 hours and 24 hours. Actin was analyzed as an internal control. The data are shown as the mean ± S.D (n=3). Statistically significant differences are indicated (*, P<0.05; **, P<0.01; ***, P<0.001). (C) Immunoblotting and densitometric analysis of Yap, YapS127, Oct4 and Nanog in wild type ES cells and Mst-/- ES cells in ES cell differentiation medium for 12 hours and 24 hours. Gapdh1 was analyzed as an internal loading control. The data are shown as the mean ± S.D (n=2). Statistically significant differences are indicated (*, P<0.05; **, P<0.01; ***, P<0.001).
Figure 4
Figure 4. Mst-/- ES cells proliferate faster than wild type ES cells.
(A) Morphology of 1x10⁵ wild type ES cells or Mst-/- ES cells grown in 2i+LIF ES medium for 2 days, 3 days and 4 days respectively. Scale bar, 200 μm. (B) Statistical analysis of the growth rate of wild type ES cells and Mst-/- ES cells on day 3 and day 4 culture. The data were shown as the mean ± S.D (n=3). Statistically significant differences are indicated (*, P<0.05; **, P<0.01; ***, P<0.001). (C) Immunofluorescence staining with BrdU antibodies to examine BrdU integration in wild type ES cells and Mst-/- ES cells after serum starvation for 12 hours. Cells are pulsed labeled with BrdU for 45 minutes. The nuclei were stained with DAPI. Scale bar, 200 μm. (D) Representative histograms of cell cycle distribution in Mst-/- ES cells and wild type ES cells. (E) Table of the cell cycle distribution in Mst-/- ES cells and wild type ES cells from two independent experiments. (F) Statistical analysis of cell cycle distribution in Mst-/- ES cells and wild type ES cells from two independent experiments. (*, P<0.05).
Figure 5
Figure 5. Depletion of Mst1/Mst2 affects proper EB differentiation.
(A) Quantitative real time PCR to reveal the mRNA level of endoderm markers Gata6 and Sox17, mesoderm markers T and Gcs, and ectoderm markers Sox1 and Nestin in wild type EBs and Mst-/- EBs at day 4 and day 8 during EB formation. Actin was analyzed as an internal control. The data were shown as the mean ± S.D (n=3). Statistically significant differences are indicated (*, P<0.05; **, P<0.01; ***, P<0.001). (B) Immunoblotting and densitometric analysis to check the protein level of Yap, YapS127, Oct4 and Nanog in day 4 and day 8 wild type EBs and Mst-/- EBs. Gapdh1 was analyzed as an internal control. The data are shown as the mean ± S.D (n=2). Statistically significant differences are indicated (*, P<0.05; **, P<0.01; ***, P<0.001).
Figure 6
Figure 6. ES cell to cardiac progenitor cell differentiation is disturbed by Mst1/Mst2 depletion.
(A) Phase contrast pictures of differentiated wild type EBs and Mst-/- EBs in cardiac differentiation medium. Scale bar, 200 μm. (B) Percentage of spontaneously beating EBs determined from day 6 to day 20 during differentiation (n>100 per time point). Mst-/-EBs showed a significant less beating EBs than wild type EBs. Experiments were performed in triplicate, and error bars represent SD. Statistically significant differences are indicated (*, P<0.05; **, P<0.01; ***, P<0.001). (C) Relative mRNA levels of cardiac progenitor cell markers Nkx2.5, Tbx5, Mesp1, Isl1 and Baf60c in wild type and Mst-/- EBs at day 4 and day 8 during EB formation. Actin was used as an internal control. The data are shown as the mean ± S.D (n=3). Statistically significant differences are indicated (*, P<0.05; **, P<0.01; ***, P<0.001). (D) Immunofluorescence stain with antibody against Nkx2.5 to examine cardiac progenitor marker Nkx2.5 expression in the wild type EBs and Mst-/- EBs in cardiac differentiation medium for 8 days. Scale bar, 200 μm. (E) Immunoblotting and denstitometric analysis with antibody against Mesp1, Isl1 and Nkx2.5 to check their expression in wild type EBs and Mst-/- EBs in cardiac differentiation medium for 4 days or 8 days. Gapdh1 was analyzed as an internal control. The data are shown as the mean ± S.D (n=2). Statistically significant differences are indicated (*, P<0.05; **, P<0.01; ***, P<0.001).
Figure 7
Figure 7. ES cell to cardiac progenitor cell differentiation is disturbed by Mst1/Mst2 depletion.
(A) Heatmap of the expression of non-canonical Wnt signaling ligands (Wnt2, Wnt2b and Wnt5a) and canonical Wnt ligands (Wnt1, Wnt3a, Wnt8a and Wnt11) in day 4 and day 8 wild type EBs and Mst-/- EBs. (B) Relative mRNA levels of β-catenin in wild type and Mst-/- EBs at day 4 and day 8 during EB formation. Actin was used as an internal control. The data are shown as the mean ± S.D (n=3). Statistically significant differences are indicated (*, P<0.05; **, P<0.01; ***, P<0.001). (C) Immunoblotting analysis with antibodies against Active β-catenin and total β-catenin to check its expression in day 4 and day 8 wild type EBs and Mst-/- EBs. Gapdh1 was analyzed as an internal control. (D) Relative mRNA levels of Wnt5a during EB formation from day0 to day10. Actin was used as an internal control. The data are shown as the mean ± S.D (n=3). Statistically significant differences are indicated (*, P<0.05; **, P<0.01; ***, P<0.001). (E) Recombinant Wnt5 were supplemented to the Mst-/-EB culture from day 2 and day 10. Wild type EBs and Mst-/- EBs were grown in non-Wnt5a supplemented medium as controls. The percentage of beating EBs was profiled on day 8 and day 10 after initiating EBs culture. The data are shown as the mean ± S.D (n=3). Statistically significant differences are indicated (*, P<0.05; **, P<0.01; ***, P<0.001).

Similar articles

Cited by

References

    1. Justice RW, Zilian O, Woods DF, Noll M, Bryant PJ (1995) The Drosophila tumor suppressor gene warts encodes a homolog of human myotonic dystrophy kinase and is required for the control of cell shape and proliferation. Genes Dev 9: 534-546. doi:10.1101/gad.9.5.534. PubMed: 7698644. - DOI - PubMed
    1. Pantalacci S, Tapon N, Léopold P (2003) The Salvador partner Hippo promotes apoptosis and cell-cycle exit in Drosophila. Nat Cell Biol 5: 921-927. doi:10.1038/ncb1051. PubMed: 14502295. - DOI - PubMed
    1. Tapon N, Harvey KF, Bell DW, Wahrer DC, Schiripo TA et al. (2002) salvador Promotes both cell cycle exit and apoptosis in Drosophila and is mutated in human cancer cell lines. Cell 110: 467-478. doi:10.1016/S0092-8674(02)00824-3. PubMed: 12202036. - DOI - PubMed
    1. Wu S, Huang J, Dong J, Pan D (2003) hippo encodes a Ste-20 family protein kinase that restricts cell proliferation and promotes apoptosis in conjunction with salvador and warts. Cell 114: 445-456. doi:10.1016/S0092-8674(03)00549-X. PubMed: 12941273. - DOI - PubMed
    1. Huang J, Wu S, Barrera J, Matthews K, Pan D (2005) The Hippo signaling pathway coordinately regulates cell proliferation and apoptosis by inactivating Yorkie, the Drosophila Homolog of YAP. Cell 122: 421-434. doi:10.1016/j.cell.2005.06.007. PubMed: 16096061. - DOI - PubMed

MeSH terms

Substances