Effects of antioxidant treatment on blast-induced brain injury
- PMID: 24224042
- PMCID: PMC3818243
- DOI: 10.1371/journal.pone.0080138
Effects of antioxidant treatment on blast-induced brain injury
Abstract
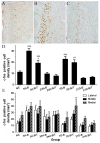
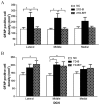
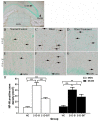
Blast-induced traumatic brain injury has dramatically increased in combat troops in today's military operations. We previously reported that antioxidant treatment can provide protection to the peripheral auditory end organ, the cochlea. In the present study, we examined biomarker expression in the brains of rats at different time points (3 hours to 21 days) after three successive 14 psi blast overpressure exposures to evaluate antioxidant treatment effects on blast-induced brain injury. Rats in the treatment groups received a combination of antioxidants (2,4-disulfonyl α-phenyl tertiary butyl nitrone and N-acetylcysteine) one hour after blast exposure and then twice a day for the following two days. The biomarkers examined included an oxidative stress marker (4-hydroxy-2-nonenal, 4-HNE), an immediate early gene (c-fos), a neural injury marker (glial fibrillary acidic protein, GFAP) and two axonal injury markers [amyloid beta (A4) precursor protein, APP, and 68 kDa neurofilament, NF-68]. The results demonstrate that blast exposure induced or up-regulated the following: 4-HNE production in the dorsal hippocampus commissure and the forceps major corpus callosum near the lateral ventricle; c-fos and GFAP expression in most regions of the brain, including the retrosplenial cortex, the hippocampus, the cochlear nucleus, and the inferior colliculus; and NF-68 and APP expression in the hippocampus, the auditory cortex, and the medial geniculate nucleus (MGN). Antioxidant treatment reduced the following: 4-HNE in the hippocampus and the forceps major corpus callosum, c-fos expression in the retrosplenial cortex, GFAP expression in the dorsal cochlear nucleus (DCN), and APP and NF-68 expression in the hippocampus, auditory cortex, and MGN. This preliminary study indicates that antioxidant treatment may provide therapeutic protection to the central auditory pathway (the DCN and MGN) and the non-auditory central nervous system (hippocampus and retrosplenial cortex), suggesting that these compounds have the potential to simultaneously treat blast-induced injuries in the brain and auditory system.
Conflict of interest statement
Figures


Similar articles
-
Antioxidants reduce neurodegeneration and accumulation of pathologic Tau proteins in the auditory system after blast exposure.Free Radic Biol Med. 2017 Jul;108:627-643. doi: 10.1016/j.freeradbiomed.2017.04.343. Epub 2017 Apr 22. Free Radic Biol Med. 2017. PMID: 28438658
-
Ameliorative Effects of Antioxidants on the Hippocampal Accumulation of Pathologic Tau in a Rat Model of Blast-Induced Traumatic Brain Injury.Oxid Med Cell Longev. 2016;2016:4159357. doi: 10.1155/2016/4159357. Epub 2015 Dec 16. Oxid Med Cell Longev. 2016. PMID: 27034735 Free PMC article.
-
Antioxidant treatment reduces blast-induced cochlear damage and hearing loss.Hear Res. 2012 Mar;285(1-2):29-39. doi: 10.1016/j.heares.2012.01.013. Epub 2012 Feb 6. Hear Res. 2012. PMID: 22326291
-
Distinct patterns of expression of traumatic brain injury biomarkers after blast exposure: role of compromised cell membrane integrity.Neurosci Lett. 2013 Sep 27;552:87-91. doi: 10.1016/j.neulet.2013.07.047. Epub 2013 Aug 7. Neurosci Lett. 2013. PMID: 23933206
-
Mechanisms and treatment of blast induced hearing loss.Korean J Audiol. 2012 Dec;16(3):103-7. doi: 10.7874/kja.2012.16.3.103. Epub 2012 Dec 18. Korean J Audiol. 2012. PMID: 24653882 Free PMC article. Review.
Cited by
-
Psychosocial impairment following mild blast-induced traumatic brain injury in rats.Behav Brain Res. 2021 Aug 27;412:113405. doi: 10.1016/j.bbr.2021.113405. Epub 2021 Jun 23. Behav Brain Res. 2021. PMID: 34097900 Free PMC article.
-
A Comprehensive Review of Experimental Rodent Models of Repeated Blast TBI.Front Neurol. 2019 Sep 27;10:1015. doi: 10.3389/fneur.2019.01015. eCollection 2019. Front Neurol. 2019. PMID: 31611839 Free PMC article. Review.
-
Blood brain barrier dysfunction and delayed neurological deficits in mild traumatic brain injury induced by blast shock waves.Front Cell Neurosci. 2014 Aug 13;8:232. doi: 10.3389/fncel.2014.00232. eCollection 2014. Front Cell Neurosci. 2014. PMID: 25165433 Free PMC article. Review.
-
Protective Effect of N-Acetylcysteine Amide on Blast-Induced Increase in Intracranial Pressure in Rats.Front Neurol. 2017 Jun 6;8:219. doi: 10.3389/fneur.2017.00219. eCollection 2017. Front Neurol. 2017. PMID: 28634463 Free PMC article.
-
Poly ADP-Ribose Polymerase-1 inhibition by 3-aminobenzamide recuperates HEI-OC1 auditory hair cells from blast overpressure-induced cell death.Front Cell Dev Biol. 2023 Mar 6;11:1047308. doi: 10.3389/fcell.2023.1047308. eCollection 2023. Front Cell Dev Biol. 2023. PMID: 36949771 Free PMC article.
References
Publication types
MeSH terms
Substances
LinkOut - more resources
Full Text Sources
Other Literature Sources
Medical
Research Materials
Miscellaneous

