. 2013 Nov 5;8(11):e80749.
doi: 10.1371/journal.pone.0080749. eCollection 2013.

Developmental switch in neurovascular coupling in the immature rodent barrel cortex

Affiliations

Developmental switch in neurovascular coupling in the immature rodent barrel cortex

Christoph M Zehendner et al. PLoS One. .

Abstract

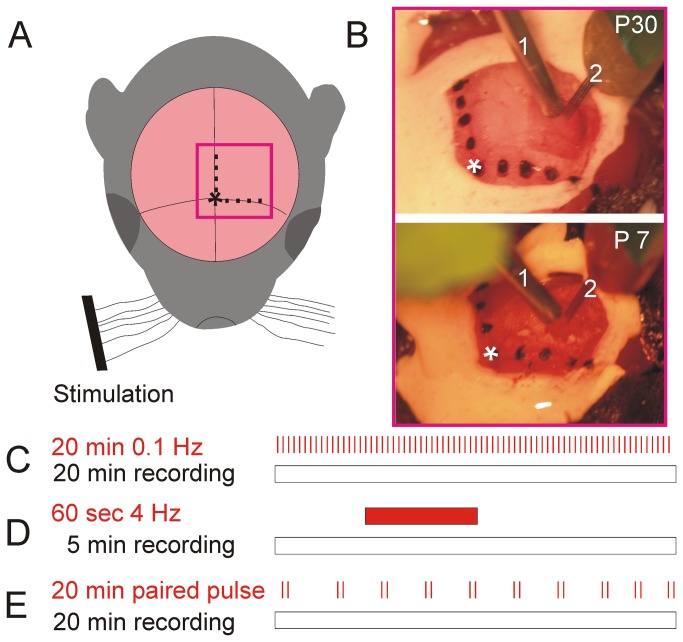
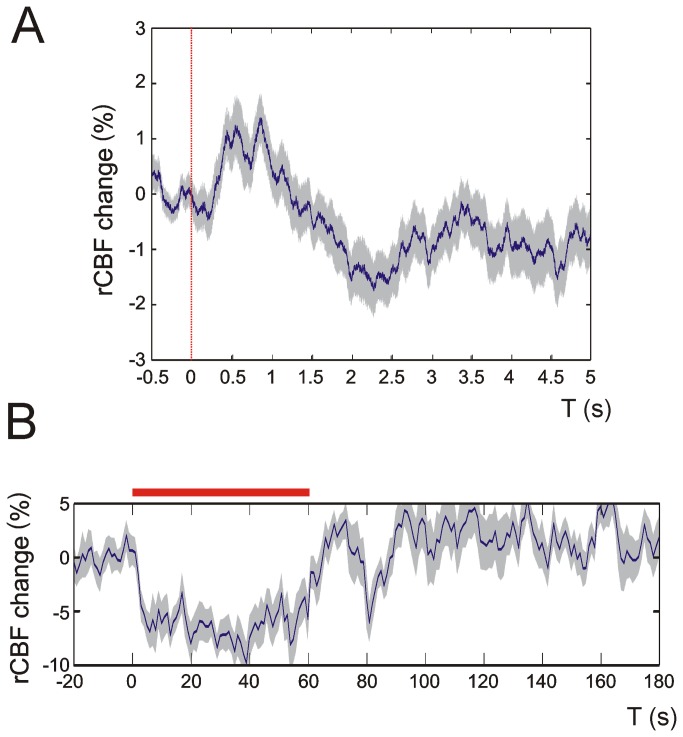
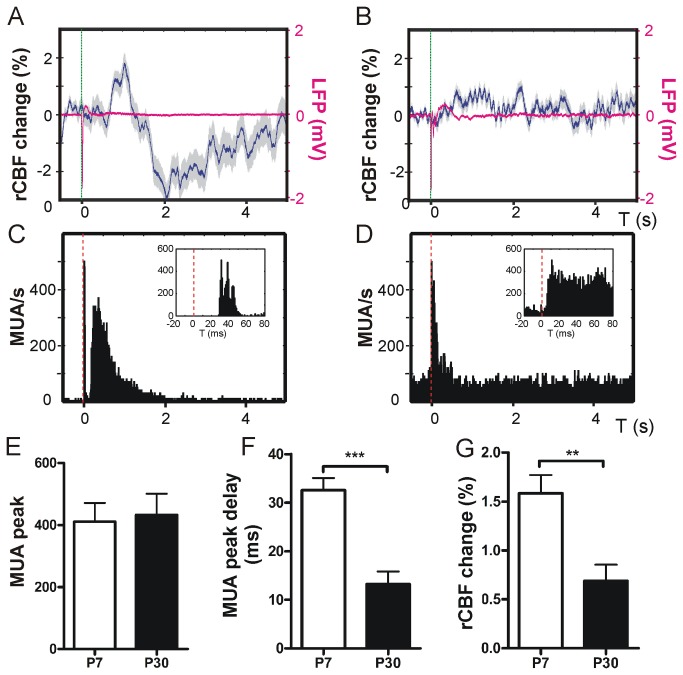
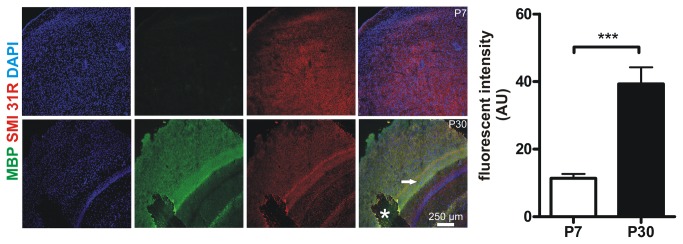
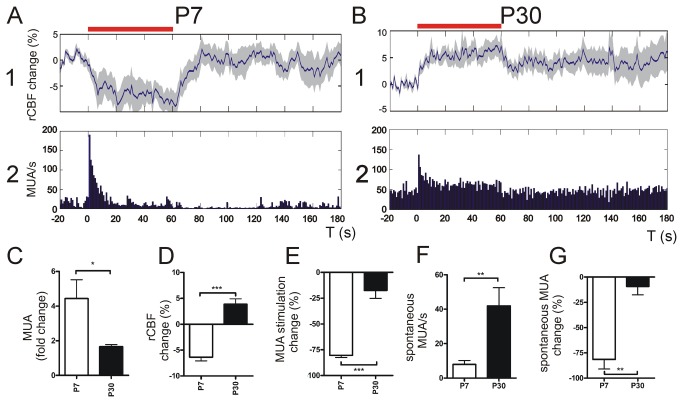
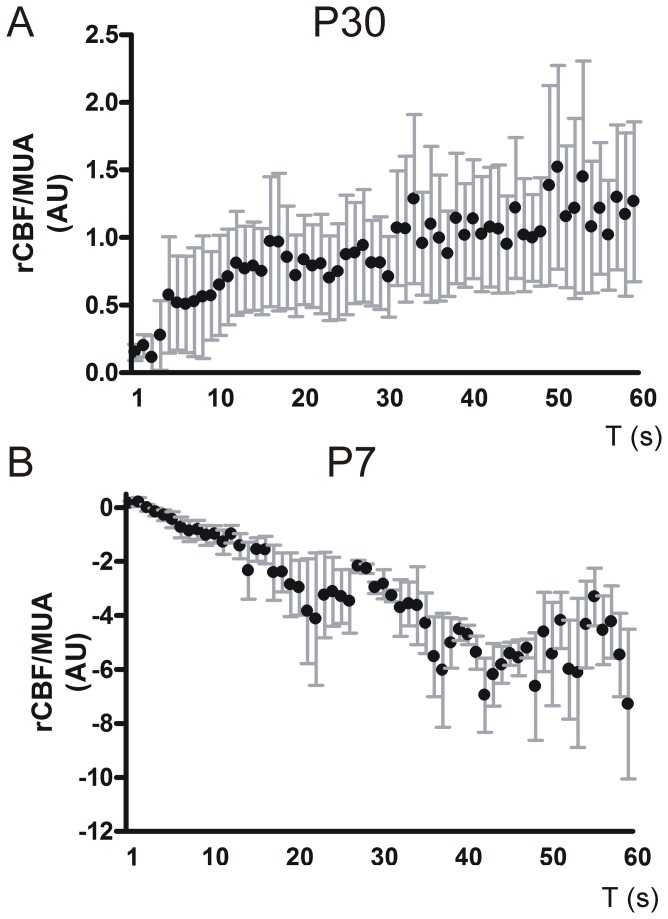
Neurovascular coupling (NVC) in the adult central nervous system (CNS) is a mechanism that provides regions of the brain with more oxygen and glucose upon increased levels of neural activation. Hemodynamic changes that go along with neural activation evoke a blood oxygen level-dependent (BOLD) signal in functional magnetic resonance imaging (fMRI) that can be used to study brain activity non-invasively. A correct correlation of the BOLD signal to neural activity is pivotal to understand this signal in neuronal development, health and disease. However, the function of NVC during development is largely unknown. The rodent whisker-to-barrel cortex is an experimentally well established model to study neurovascular interdependences. Using extracellular multi-electrode recordings and laser-Doppler-flowmetry (LDF) we show in the murine barrel cortex of postnatal day 7 (P7) and P30 mice in vivo that NVC undergoes a physiological shift during the first month of life. In the mature CNS it is well accepted that cortical sensory processing results in a rise in regional cerebral blood flow (rCBF). We show in P7 animals that rCBF decreases during prolonged multi-whisker stimulation and goes along with multi unit activity (MUA) fatigue. In contrast at P30, MUA remains stable during repetitive stimulation and is associated with an increase in rCBF. Further we characterize in both age groups the responses in NVC to single sensory stimuli. We suggest that the observed shift in NVC is an important process in cortical development that may be of high relevance for the correct interpretation of brain activity e.g. in fMRI studies of the immature central nervous system (CNS).


Conflict of interest statement

Competing Interests: HJL was supported by DFG grants (DFG FOR 1341 "Barrel Cortex Function"), CMZ is supported by a Stufe 1 grant of the University Medical Center of the Johannes Gutenberg-University Mainz, ST is supported by the Deutsche Studienstiftung. The funders had no role in study design, data collection and analysis, decision to publish, or preparation of the manuscript.

Figures

Figure 1
Figure 1. Experimental setup and stimulation protocols.
For NVC analyses the bregma position (asterisk) and localization of the barrel cortex were identified. Barrel cortex was activated by mechanical stimulation of multiple whiskers (A). A craniotomy was performed and the LDF probe (1) was positioned 300 - 500 µm above the barrel cortex. A four-shank 16-channel electrode (2) was inserted into the barrel cortex at a depth of 200 - 300 µm (B). To detect neurovascular whisker-evoked cortical responses different stimulation protocols were used: 0.1 Hz stimulation for 20 minutes in order to detect NVC responses upon single multi-whisker stimulation (C); 4 Hz stimulation lasting 60 seconds during a total recording period of 5 minutes to investigate NVC in prolonged stimulation (D); Paired pulse stimulations at different frequencies for 20 minutes to elucidate neuronal inhibition at various time points after initial whisker stimulation (E).
Figure 2
Figure 2. rCBF changes upon multi-whisker stimulation in intact skull recordings.
rCBF recordings in intact skull preparations indicate that the craniotomy in our experimental setup did not affect rCBF measurements. Panel A shows an average 0.1 Hz recording trace from 100 stimulation events of a P7 mouse. In B an average 4 Hz recording is displayed. Note that both traces display similar shapes and characteristics compared with rCBF traces obtained in craniotomy (see Figures 3 and 6). Dashed red line in A: single multi-whisker stimulus, red bar in B: 4 Hz multi-whisker stimulation. Grey shades indicate + SEM. Representative recording traces from 3 P7 animals are displayed.
Figure 3
Figure 3. Single multi-whisker stimulation.
Single stimulation of multiple whiskers (stimulus is indicated by the dashed green line) resulted in a biphasic rCBF response at P7 with an initial rise in rCBF that was followed by a rCBF decline. The rCBF showed a trend to recover to baseline (representative rCBF trace of 100 averaged 0.1 Hz recordings in one P7 mouse and the corresponding LFP trace in magenta, A). At P30 (B) single-whisker stimulation evoked a small rise in rCBF (corresponding LFP trace is depicted in magenta). Simultaneous recordings of MUA revealed an initial maximum following stimulation (C, representative MUA PSTH plot of 100 recordings in one P7 mouse, inset exemplifies MUA peak delay upon stimulation) that was followed by a delayed MUA response in P7 lasting about 2 seconds. At P30 stimulation resulted in a similar MUA response but the delayed MU activity was not as strong as in P7 mice (representative MUA recording of one P30 mouse D). Single multi-whisker stimulation resulted in a similar amount of maximum MUA recruitment at both age groups (E). MU activity peak delay was significantly longer at P7 compared with P30 (F) whilst the maximum increase of rCBF was higher at P7 compared with P30 within the first 5 seconds after single stimulation (G). Grey shades in panels A and B indicate + SEM. Note that SEM does not visualize in LFP traces due to very small SEM.
Figure 4
Figure 4. Murine cortices are less myelinated at P7 compared with P30.
In order to determine myelination MBP expression was studied in cortices of P7 and P30 mice. Representative z-stack maximum projections (700 nm thickness of stacks) from 3 animals per group are shown (MBP green, the axonal marker SMI 31-R in red, DAPI blue). Note that MBP is nearly absent in the P7 cortex whilst there is high MBP expression at P30. Note the highly myelinated intermediate zone marked with an arrowhead. Asterisk marks a preparation artifact. Quantitative analyses of MBP fluorescence (AU: arbitrary units) demonstrate a significantly smaller MBP expression at P7. Pictures were acquired using equal time exposures and laser intensities.
Figure 5
Figure 5. Neuronal excitability following a single whisker stimulation is reduced at P7.
In paired pulse experiments neuronal excitability upon single whisker stimulation was assessed for up to 10 seconds after initial stimulus. Paired pulses at 1 Hz to 0.2 Hz revealed a significant reduction in LFP amplitude as shown by representative LFPs in upper traces and bar diagrams at P7 (A). Ten seconds after initial stimulus neuronal excitability was fully recovered in P7 mice (A). In P30 mice neuronal excitability was restored within 500 ms (Panel B). Each paired pulse was applied at an interval of 20 seconds. Red arrowheads: stimulus; ** P < 0.01; * P < 0.05.
Figure 6
Figure 6. Prolonged multi-whisker stimulation.
At P7 prolonged multi-whisker stimulation at 4 Hz resulted in a decline in rCBF. rCBF declined until it reached a plateau and slowly recovered to baseline within 20 - 30 s after the end of stimulation (A 1). In P30 4 Hz stimulation caused a rCBF increase until a plateau was reached and declined after stimulation. In many cases rCBF did not reach baseline levels but remained slightly elevated (B 1). Simultaneous MUA recordings in the barrel cortex of P7 mice demonstrated an initial rise in MUA that decreased during ongoing stimulation (A 2). Note that the baseline MUA after stimulation appears to be reduced compared with MUA before stimulation indicating spontaneous MUAF. At P30 MUA responded in a similar manner as in P7 but the prominent decrease in spontaneous MUA after stimulation was not apparent (B 2). At P7 the MUA increase related to baseline MUA before stimulation was significantly higher than at P30 (C). The average rCBF change during stimulation compared with baseline was also significantly different in both age groups. At P7 rCBF decreased while during stimulation rCBF increased at P30 (D). MUA decrease over stimulation time was significantly higher in P7 compared with P30 (E). In contrast spontaneous MUA before stimulation was higher at P30 compared with P7 (F). Statistical analyses of MUA after stimulation compared with MUA levels before stimulation show a significant reduction in spontaneous MUA following 4 Hz whisker deflection in P7 that is much less pronounced in P30 (G). Red bar indicates 4 Hz stimulation; *** P < 0.001; ** P < 0.01; * P < 0.05. Grey shades in rCBF panels A and B indicate + SEM.
Figure 7
Figure 7. Correlation of rCBF/MUA ratio and stimulation time.
rCBF values were correlated to corresponding MUA and were plotted against stimulation time in arbitrary units (AU). rCBF per MUA increases over stimulation in P30 mice and is significantly positively correlated with stimulation duration (A). In contrast rCBF decreased per MUA over stimulation time in P7 mice. Here the correlation coefficient was negatively correlated (B). Error bars indicate + SEM.

Similar articles

Cited by

References

    1. Feldmeyer D, Brecht M, Helmchen F, Petersen CCH, Poulet JFA et al. (2013) Barrel cortex function. Prog Neurobiol 103: 3–27. doi:10.1016/j.pneurobio.2012.11.002. PubMed: 23195880. - DOI - PubMed
    1. Petersen CCH, Crochet S (2013) Synaptic Computation and Sensory Processing in Neocortical Layer 2/3. Neuron 78: 28–48. doi:10.1016/j.neuron.2013.03.020. PubMed: 23583106. - DOI - PubMed
    1. Harris JJ, Jolivet R, Attwell D (2012) Synaptic energy use and supply. Neuron 75: 762–777. doi:10.1016/j.neuron.2012.08.019. PubMed: 22958818. - DOI - PubMed
    1. Harris JJ, Reynell C, Attwell D (2011) The physiology of developmental changes in BOLD functional imaging signals. Dev. J Cogn Neurosci 1: 199–216. doi:10.1016/j.dcn.2011.04.001. - DOI - PMC - PubMed
    1. Attwell D, Buchan AM, Charpak S, Lauritzen M, Macvicar BA et al. (2010) Glial and neuronal control of brain blood flow. Nature 468: 232–243. doi:10.1038/nature09613. PubMed: 21068832. - DOI - PMC - PubMed

Publication types

LinkOut - more resources