

A Hierarchical Distance Sampling Approach to Estimating Mortality Rates from Opportunistic Carcass Surveillance Data
- PMID: 24224079
- PMCID: PMC3818731
- DOI: 10.1111/2041-210x.12021
A Hierarchical Distance Sampling Approach to Estimating Mortality Rates from Opportunistic Carcass Surveillance Data
Abstract
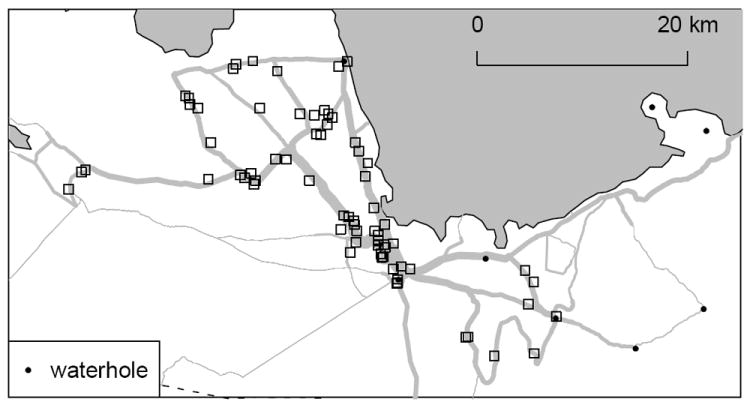
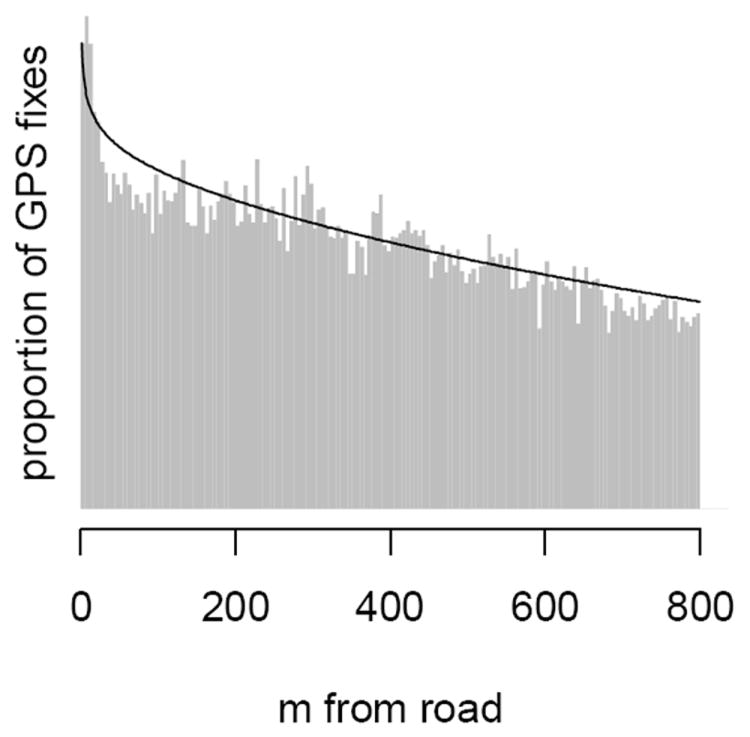
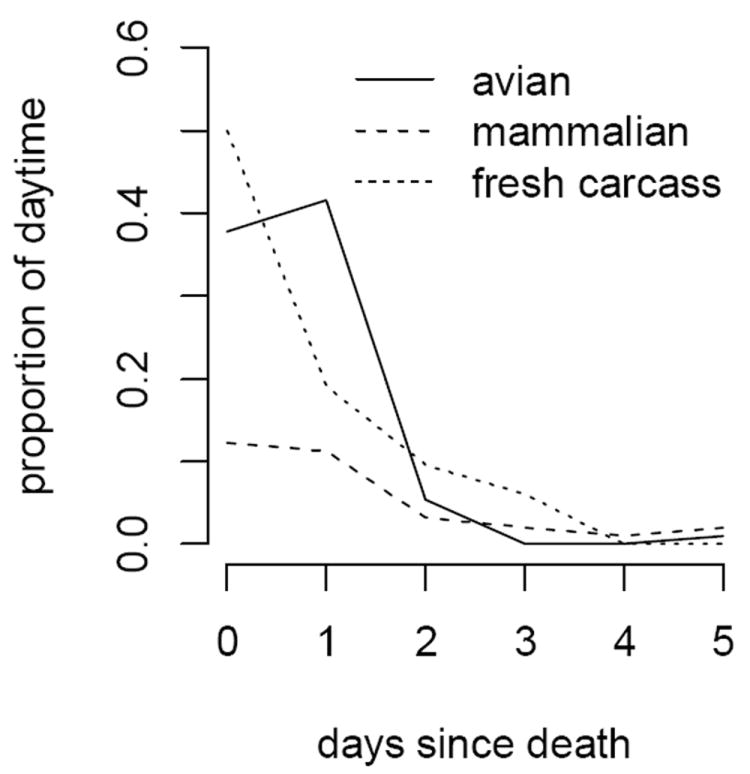
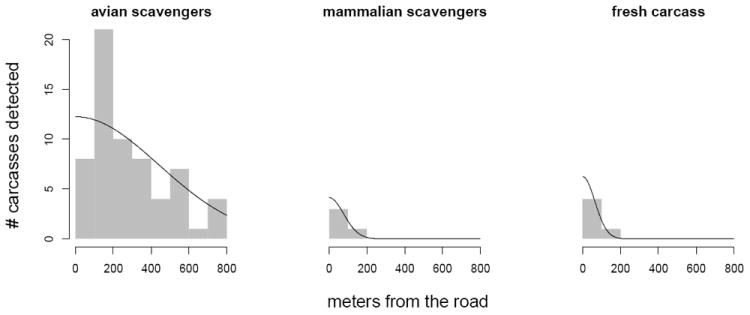
Distance sampling is widely used to estimate the abundance or density of wildlife populations. Methods to estimate wildlife mortality rates have developed largely independently from distance sampling, despite the conceptual similarities between estimation of cumulative mortality and the population density of living animals. Conventional distance sampling analyses rely on the assumption that animals are distributed uniformly with respect to transects and thus require randomized placement of transects during survey design. Because mortality events are rare, however, it is often not possible to obtain precise estimates in this way without infeasible levels of effort. A great deal of wildlife data, including mortality data, is available via road-based surveys. Interpreting these data in a distance sampling framework requires accounting for the non-uniformity sampling. Additionally, analyses of opportunistic mortality data must account for the decline in carcass detectability through time. We develop several extensions to distance sampling theory to address these problems.We build mortality estimators in a hierarchical framework that integrates animal movement data, surveillance effort data, and motion-sensor camera trap data, respectively, to relax the uniformity assumption, account for spatiotemporal variation in surveillance effort, and explicitly model carcass detection and disappearance as competing ongoing processes.Analysis of simulated data showed that our estimators were unbiased and that their confidence intervals had good coverage.We also illustrate our approach on opportunistic carcass surveillance data acquired in 2010 during an anthrax outbreak in the plains zebra of Etosha National Park, Namibia.The methods developed here will allow researchers and managers to infer mortality rates from opportunistic surveillance data.
Keywords: Carcass; Cue; Disease; Distance sampling; Hierarchical model; Mortality; Opportunistic surveillance.
Conflict of interest statement
The authors declare no conflicts of interest.
Figures
References
-
- Buckland ST, Anderson DR, Burnham KP, Laake JL, Borchers DL, Thomas L. Advanced distance sampling. Oxford University Press; Oxford: 2004.
-
- Buckland ST, Anderson DR, Burnham KP, Laake JL, Borchers DL, Thomas L. Introduction to distance sampling: Estimating abundance of biological populations. Oxford University Press; Oxford: 2001.
-
- Buckland ST, Goudie IBJ, Borchers DL. Wildlife population assessment: Past developments and future directions. Biometrics. 2000;56:1–12. - PubMed
-
- Buckland ST, Laake JL, Borchers DL. Double-observer line transect methods: Levels of independence. Biometrics. 2010;66:169–177. - PubMed
-
- de Segura AG, Hammond PS, Canadas A, Raga JA. Comparing cetacean abundance estimates derived from spatial models and design-based line transect methods. Marine Ecology-Progress Series. 2007;329:289–299.
Grants and funding
LinkOut - more resources
Full Text Sources
Other Literature Sources