. 2013:4:10.5194/hgss-4-47-2013.
doi: 10.5194/hgss-4-47-2013.

27-day cycles in human mortality: Traute and Bernhard Düll

Affiliations

27-day cycles in human mortality: Traute and Bernhard Düll

F Halberg et al. Hist Geo Space Sci. 2013.

Abstract

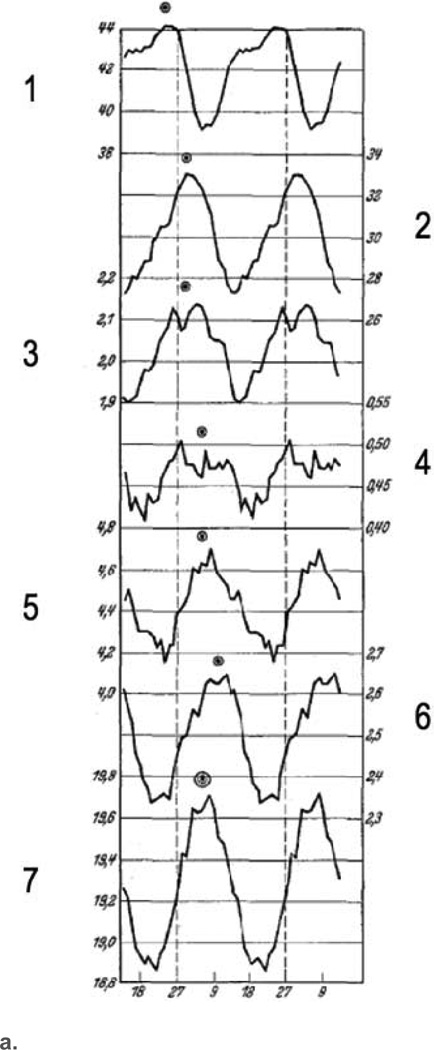
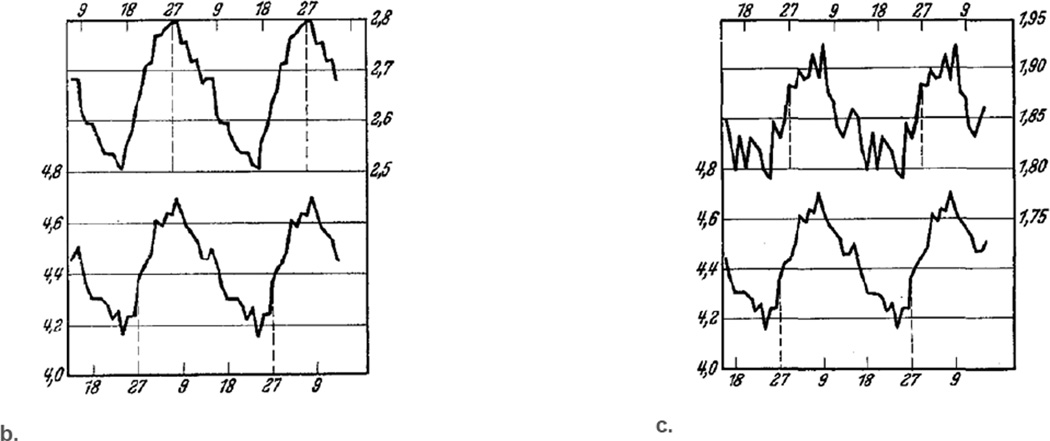
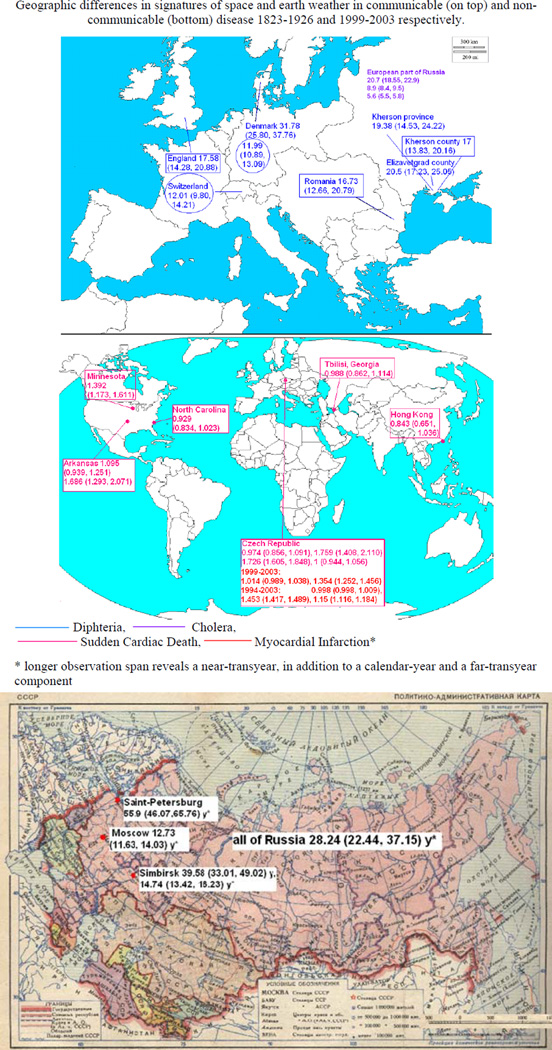
This tribute to her parents by one co-author (NDP) is the fruit of a more than a decade-long search by the senior author (FH) for the details of the lives of Bernhard and Gertraud ("Traute") Düll. These pioneers studied how space/terrestrial weather may differentially influence human mortality from various causes, the 27-day mortality pattern being different whether death was from cardiac or respiratory disease, or from suicide. FH is the translator of personal information about her parents provided by NDP in German. Figuratively, he also attempts to "translate" the Dülls' contribution in the context of the literature that had appeared before their work and after their deaths. Although the Dülls published in a then leading journal, among others (and FH had re-analyzed some of their work in a medical journal), they were unknown to academies or libraries (where FH had inquired about them). The Dülls thoroughly assembled death certificates to offer the most powerful evidence for an effect of solar activity reflected in human mortality, as did others before them. They went several steps further than their predecessors, however. They were the first to show possibly differential effects of space and/or Earth weather with respect to suicide and other deaths associated with the nervous and sensory systems vs. death from cardiac or respiratory disease as well as overall death by differences in the phase of a common 27-day cycle characterizing these mortality patterns. Furthermore, Bernhard Düll developed tests of human visual and auditory reaction time to study effects of weather and solar activity, publishing a book (his professorial dissertation) on the topic. His unpublished finding of an increased incidence of airplane crashes in association with higher solar activity was validated after his death, among others, by Tatiana Zenchenko and A. M. Merzlyi.


Figures

Figure 1
Figure 1
With data from Düll and Düll taken off their published graph (Düll and Düll, 1935a), summarizing the daily incidence of mortality from neural and mental disease and from suicides in relation to “electro-invasion” by superposed epochs over 67 solar rotation cycles between 1928 and 1932 (left), we find a maximal cross-correlation at a 1-day lag (right). By electro-invasion, the authors referred to “short-lived” eruptions on the surface of the Sun (M-regions of the Sun, presumably corresponding to what is now known as coronal mass ejections), as defined by Bartels (1932). The electrical particles ejected by these solar phenomena, when they reach Earth, elicit electron invasions, the extent of which is characterized by the extent of disturbance of the electromagnetic field. © Halberg.
Figure 2
Figure 2
Traute and Bernhard Düll, a gifted couple of scientists whose early work discussed, with data stacked over 68 consecutive 27-day cycles, the differential associations of helio- and geomagnetism with mortality from mental illness vs. vascular, respiratory and overall mortality.
Figure 3
Figure 3
Northern lights in Iceland, painted by Traute Düll (top). She is also seen as an assistant carrying out computations (bottom).
Figure 4
Figure 4
With the technology of his era, Bernhard Düll tried to develop a test system for human reaction time that he believed was influenced by space weather. The reason for his work is confirmed by the subsequent demonstration that human time estimation, by the criterion of shared frequencies, more than matches, in its association with either helio- or geomagnetism, the accepted association of the two magnetisms with each other (by statistically significant odds ratios, Fig. 5) (Halberg, 2011).
Figure 5
Figure 5
Some inferentially statistically validated congruences of human somatic and mental functions with the environment, gauged by the antipodal geomagnetic disturbance value (aa) (top) and solar wind speed (SWS) (bottom). While limited to a single clinically healthy case (R.B.S., a man aging during the study from 20 to 60 yr of age), the number of congruences found for the estimation of 1 min and for mood in the spectral range investigated (from one cycle in 2.5 yr to 3 cycles per year) more than equals that of the known association of helio- and geomagnetism. When congruence is assessed by means of the odds ratio based on the non-central hypergeometric distribution, mental functions show higher congruence than somatic functions. P values are based on the non-central Fisher hypergeometric distribution, with 95 % CIs (confidence intervals) computed using Fisher’s exact test. DBP: diastolic blood pressure, Temp: oral temperature, HR: heart rate, SBP: systolic blood pressure, 1 MTE: 1 min time estimation. SBP approximates higher congruence with environment of mental (red) (versus somatic, green) functions that compare favorably with congruence of aa versus SWS (blue, bottom right). ©Halberg.
Figure 6
Figure 6
a. Time courses during 68 stacked consecutive 27-day solar rotations in the span from 1 January 1928 to 31 December 1932, as superposed epochs for two environmental (top) and five biospheric variables (bottom; mortalities in Copenhagen), the latter showing two peaklets in rows 3 and 4 and one peak in rows 5–7. That the magnetisms of the Sun and the Earth differ in phase, and that so do various human mortalities, is apparent from Table 1, from overlapping sets of CIs (95% confidence intervals) of the acrophases (phase of maximum of the cosine curve fitted to the data), φs, i.e., of peaks in 27-day cosine curves best approximating all data and providing numerical estimates of the φ and its uncertainty. The variables are 1. relative sunspot numbers; 2. worldwide magnetic characters; 3. 3720 deaths of children and adults (C+A) and males (M) and females (F) attributed to nervous and sensory system diseases; 4. 849 suicides (A, M+F); 5. 8099 deaths (C+A, M+F) from diseases of blood circulation, also including marasmus senilis (A, M+F); 6. 4579 deaths (C+A, M+F) from respiratory diseases; 7. 35244 deaths (C+A, M+F) from all causes (other than homicide). Dots above each curve indicate the day the maximum occurred during the Bartels cycle. From Düll and Düll (1934a). b. Time courses during 68 stacked solar rotations between 1 January 1928 and 31 December 1932 in auroral character (top) and 8099 cardiovascular deaths of children and adults, both male and female, in Copenhagen. From Düll and Düll (1934a). c. Time courses of cardiovascular deaths, 3381 in Zürich (top) and 8099 in Copenhagen (bottom), during 68 consecutive, stacked, separate 27-day sections of the time series from 1 January 1928 to 31 December 1932. From Düll and Düll (1934a).
Figure 6
Figure 6
a. Time courses during 68 stacked consecutive 27-day solar rotations in the span from 1 January 1928 to 31 December 1932, as superposed epochs for two environmental (top) and five biospheric variables (bottom; mortalities in Copenhagen), the latter showing two peaklets in rows 3 and 4 and one peak in rows 5–7. That the magnetisms of the Sun and the Earth differ in phase, and that so do various human mortalities, is apparent from Table 1, from overlapping sets of CIs (95% confidence intervals) of the acrophases (phase of maximum of the cosine curve fitted to the data), φs, i.e., of peaks in 27-day cosine curves best approximating all data and providing numerical estimates of the φ and its uncertainty. The variables are 1. relative sunspot numbers; 2. worldwide magnetic characters; 3. 3720 deaths of children and adults (C+A) and males (M) and females (F) attributed to nervous and sensory system diseases; 4. 849 suicides (A, M+F); 5. 8099 deaths (C+A, M+F) from diseases of blood circulation, also including marasmus senilis (A, M+F); 6. 4579 deaths (C+A, M+F) from respiratory diseases; 7. 35244 deaths (C+A, M+F) from all causes (other than homicide). Dots above each curve indicate the day the maximum occurred during the Bartels cycle. From Düll and Düll (1934a). b. Time courses during 68 stacked solar rotations between 1 January 1928 and 31 December 1932 in auroral character (top) and 8099 cardiovascular deaths of children and adults, both male and female, in Copenhagen. From Düll and Düll (1934a). c. Time courses of cardiovascular deaths, 3381 in Zürich (top) and 8099 in Copenhagen (bottom), during 68 consecutive, stacked, separate 27-day sections of the time series from 1 January 1928 to 31 December 1932. From Düll and Düll (1934a).
Figure 7
Figure 7
Analysis of what Joseph Vallot, a thoughtful physicist and philanthropist, reported as an association of symptoms with solar activity over 90 yr ago. Specifically, the incidence of clinical symptoms of diseases of the heart, blood vessels, liver, kidney and nervous system, ranging from mild to severe (such as excitability, insomnia, tiredness, aches, muscle twitches, polyuria, digestive troubles, jitteriness, shivering, spasms, neuralgia, neural crises, asthma, dyspnea, fever, pain, vertigo, syncope, high blood pressure, tachycardia, arrhythmia, and true angina pectoris) is compared between days when sunspots were present or absent. Results from our χ2 tests confirm that symptoms were more likely to occur on days with than on days without sunspots, whether all symptoms or only the more severe ones (according to the original authors) were considered. Data from Vallot et al. (1922). © Halberg.
Figure 8
Figure 8
Many different cycles actually characterize mortality from diphtheria in Europe (top), cholera in Russia and India (middle), and overall mortality in Russia (bottom), albeit discussed by Chizhevsky as a signature of an about 11 yr cycle (top and bottom charts). Results on diphtheria and cholera data collected by Chizhevsky are compared with those on shorter records on mortality from myocardial infarction and sudden cardiac death in several different geographic locations (middle chart). In each case, the length of the cycle’s period is listed with its 95 % confidence interval (in parentheses) derived by nonlinear least squares. Periods are computed according to Marquardt’s conservative method, except for those with an *, denoting 1-parameter limits. © Halberg.
Figure 9
Figure 9
Superposed epochs demonstrate association of aviation accidents (A) and events due to human error (—) vs. those due to mechanical error (- - -) (B and C) with reversals of the polarity of the interplanetary magnetic field (A and B) or at high densities of solar wind speed (C). (A) Distribution of the total number of aviation accidents in the neighborhood of the times observed on Earth when the polarity of the interplanetary magnetic field (IMF) reverses during the span from 1964–2005 (Zenchenko et al., 2005). The likelihood that differences between the zero day and samples from other days are due to chance is less than 5 %. © Zenchenko. (B) Distribution of the total number of aviation events in the neighborhood of dates characterized by passage of IMF sector boundaries for the span from 1997–2005, the solid line (—) for human error, the dashed line (- -) for mechanical failure-related events (Zenchenko and Merzlyi, 2008). © Zenchenko. (C) Distribution of the total number of aviation events (N) in the neighborhood dates of high densities of solar wind (n > 10 cm−3) for the span from 1997–2005, the solid line (—) for human error, the dashed line (- -) for mechanical failure-related events (Zenchenko and Merzlyi, 2008). Courtesy of Tatiana A. Zenchenko.
Figure 10
Figure 10
When two variables undergo periodic changes with the same period but different phases, the correlation coefficient yields spurious results, being positive when the two variables are in phase, negative when they are out of phase, and negligible when they are in quadrature. In such situations, the cross-correlation function should be used or other procedures that account for cycles instead of the Pearson product-moment correlation coefficient. © Halberg.
Figure 11
Figure 11
Top: association of magnetic storms and mortality from myocardial infarction (MI) not detected (“No”) in the United States (from daily data from 1962–1966 and from only monthly data up to 1971) yet detected (“Yes”) in Russia (including morbidity) during 3 yr in 1979–1981 (Cornelissen et al., 2002) and earlier by many authors (Vallot et al., 1922; Sardou and Faure, 1927; Chizhevsky, 1930a, b, 1931a, b, 1934, 1976; Faure, 1932). Bottom: association also detected (“Yes”) in 1962–1968 in Russia and in 1974–1976 in Israel, at a minimum of the Schwabe (about 10.5 yr) cycle, as well as in Minnesota during 1968–1996 (horizontal arrow). © Halberg.

Similar articles

Cited by

References

    1. Bartels J. Terrestrial-magnetic activity and its relation to solar phenomena. Terr. Magn. Atmos. Electr. 1932;37:1–52.
    1. Chizhevsky AL. Les périodes solaires et la mortalité. La Côte d’Azur médicale (Toulon) 11, No. 1930a;9:232.
    1. Chizhevsky AL. La Natalité et la tension de l’activite solaire. La Côte d’Azur médicale (Toulon) 1930b;11:2.
    1. Chizhevsky AL. Influences des variations de l’activité solaire sur la natalité et sur la mortalité. Bulletin de l’Académie du Var (Toulon) 1931a;Vol. 98
    1. Chizhevsky AL. L’activité solaire et la mortalité. Bulletin de l’Academie du Var (Toulon) 1931b;Vol. 98

LinkOut - more resources