

Population dynamics of cocirculating swine influenza A viruses in the United States from 2009 to 2012
- PMID: 24224819
- PMCID: PMC5655888
- DOI: 10.1111/irv.12193
Population dynamics of cocirculating swine influenza A viruses in the United States from 2009 to 2012
Abstract
Background: Understanding the ecology and evolution of influenza A viruses (IAV) in mammalian hosts is critical to reduce disease burden in production animals and lower zoonotic infection risk in humans. Recent advances in influenza surveillance in US swine populations allow for timely epidemiological, phylogenetic, and virological analyses that monitor emergence of novel viruses and assess changes in viral population dynamics.
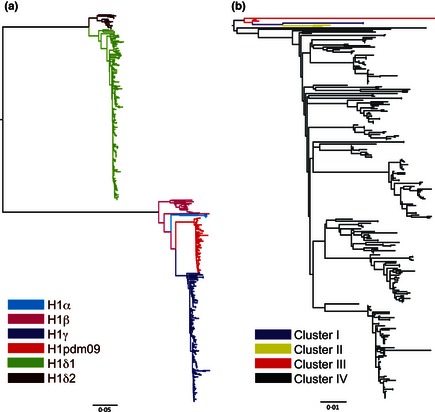
Methods: To better understand IAV in the North American swine population, we undertook a phylogenetic analysis of 1075 HA, 1049 NA, and 1040 M sequences of IAV isolated from US swine during 2009-2012 through voluntary and anonymous submissions to the US Department of Agriculture IAV swine surveillance system.
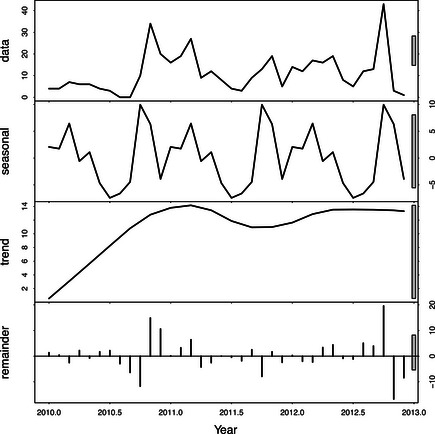
Results: Analyses revealed changes in population dynamics among multiple clades of A/H1N1, A/H3N2, and A/H1N2 cocirculating in US swine populations during 2009-2012. Viral isolates were categorized into one of seven genetically and antigenically distinct hemagglutinin lineages: H1α, H1β, H1γ, H1δ1, H1δ2, H1pdm09, and H3 cluster IV. There was an increase in occurrence of H1δ1 in samples submitted, with a concurrent decrease in H1pdm09. H3 cluster IV exhibited increasing diversification, warranting a re-evaluation of phylogenetic nomenclature criteria. Although H3N2 represented 25% of identified viruses, this subtype was reported in increasing proportion of sequenced isolates since late 2011.
Conclusions: Surveillance and reporting of IAV in US swine have increased since 2009, and we demonstrate a period of expanded viral diversity. These data may be used to inform intervention strategies of vaccine and diagnostic updates and changes in swine health management.
Keywords: Epidemiology; influenza A virus; surveillance; swine; vaccines; zoonotic diseases.
Published 2013. This article is a U.S. Government work and is in the public domain in the USA.
Figures


References
-
- Kasowski EJ, Garten RJ, Bridges CB. Influenza pandemic epidemiologic and virologic diversity: reminding ourselves of the possibilities. Clin Infect Dis 2011; 52(Suppl 1):S44–S49. - PubMed
-
- Peiris JS, Poon LL, Guan Y. Public health. Surveillance of animal influenza for pandemic preparedness. Science 2012; 335:1173–1174. - PubMed
-
- Brown IH, Harris PA, McCauley JW, Alexander DJ. Multiple genetic reassortment of avian and human influenza A viruses in European pigs, resulting in the emergence of an H1N2 virus of novel genotype. J Gen Virol 1998; 79(Pt 12):2947–2955. - PubMed
Publication types
MeSH terms
Substances
LinkOut - more resources
Full Text Sources
Other Literature Sources
