. 2014 Feb;111(3):613-27.
doi: 10.1152/jn.00841.2011. Epub 2013 Nov 13.

Shape selectivity and remapping in dorsal stream visual area LIP

Affiliations

Shape selectivity and remapping in dorsal stream visual area LIP

Janani Subramanian et al. J Neurophysiol. 2014 Feb.

Abstract

We explore the visual world by making rapid eye movements (saccades) to focus on objects and locations of interest. Despite abrupt retinal image shifts, we see the world as stable. Remapping contributes to visual stability by updating the internal image with every saccade. Neurons in macaque lateral intraparietal cortex (LIP) and other brain areas update information about salient locations around the time of a saccade. The depth of information transfer remains to be thoroughly investigated. Area LIP, as part of the dorsal visual stream, is regarded as a spatially selective area, yet there is evidence that LIP neurons also encode object features. We sought to determine whether LIP remaps shape information. This knowledge is important for understanding what information is retained from each glance. We identified 82 remapping neurons. First, we presented shapes within the receptive field and tested for shape selectivity in a fixation task. Among the remapping neurons, 28 neurons (34%) were selective for shape. Second, we presented the same shapes in the future location of the receptive field around the time of the saccade and tested for shape selectivity during remapping. Thirty-one (38%) neurons were selective for shape. Of 11 neurons that were shape selective in both tasks, 5 showed significant correlation between shape selectivity in the two tasks. Across the population, there was a weak but significant correlation between responses to shape in the two tasks. Our results provide neurophysiological evidence that remapped responses in area LIP can encode shape information as well as spatial information.

Keywords: monkey; parietal; spatial updating.


Figures

Fig. 1.
Fig. 1.
Task design. A: fixation task. After fixation is attained, 1–4 nonrepeating shapes were presented sequentially in the receptive field (RF). Shapes were presented for 50 ms with an interstimulus interval of 350 ms. B: single-step task. The monkey maintains fixation for 300–500 ms. The fixation point (FP) is then extinguished and a new fixation point appears (FP2). Simultaneously, a stimulus is briefly flashed in the future field (FF) for 50 ms. FF is the screen location that will occupy the neuron's RF once the saccade is completed. Offset of the initial FP cues the monkey to make a saccade to FP2. The monkey maintains gaze at FP2 for an additional 500–700 ms. C: stimulus control task. During fixation, a spot is briefly flashed (50 ms) at the FF location. The monkey continues to maintain fixation for an additional 1,200–1,500 ms. D: saccade control task. The trial begins when the monkey attains central fixation. After 300–500 ms, FP is extinguished and a new fixation point (FP2) appears. The monkey makes a saccade to FP2 and maintains fixation for 300–500 ms. No stimulus appears during the trial. E: a set of 8 stimuli were used to test for shape selectivity in fixation and single-step tasks. Each shape fit into a 2.2° square. Each shape had 180 white pixels and 220 black pixels (contrast inversed in image).
Fig. 2.
Fig. 2.
Visual responses of 2 neurons (A and B) selective for shape (top) in the fixation task. Histograms are plotted in 10-ms bins and are aligned on stimulus onset. Raster plots indicate the time of individual spikes for each trial. Visual activity is measured during a 200-ms epoch aligned on the beginning of the visual response (outlined box). Most preferred and least preferred shapes are indicated.
Fig. 3.
Fig. 3.
Population measures of strength of selectivity in fixation task. In A–C, gray bars represent values and responses of nonselective cells, and black bars represent values and responses of selective cells. A: selectivity index (SI) values. B: depth of selectivity (DOS) index values. Gray arrowheads indicate median index of nonselective neurons; black arrowheads indicate median index of selective neurons. C: for each neuron, responses to each shape from each task were divided by the response to the most preferred shape in that task. Normalized responses are plotted as a function of rank.
Fig. 4.
Fig. 4.
Response of a shape-selective neuron in the single-step task. Histograms are plotted in 10-ms bins and are aligned on saccade onset (A and C) or stimulus onset (B). A: responses to each of the 8 shapes in the single-step task. A 200-ms epoch aligned on the beginning of remapped response (outlined box) was used to measure average firing rate. For the neuron shown, stimulus was turned off ∼194 ms (SD 47 ms) before saccade onset. B: response in the stimulus control task when the stimulus was presented in the future field but no saccade was made. C: response in the saccade control task when no stimulus was presented in the future field. D: tuning of shape selectivity during remapping. Responses are ranked from most preferred (rank 1) to least preferred (rank 8).
Fig. 5.
Fig. 5.
Response of a shape-selective neuron in the single-step task. Conventions are the same as in Fig. 4. For the neuron shown, stimulus was turned off ∼262 ms (SD 47 ms) before saccade onset.
Fig. 6.
Fig. 6.
Population measures of strength of selectivity in single-step task. Conventions are the same as in Fig. 3.
Fig. 7.
Fig. 7.
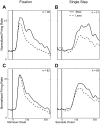
Shape selectivity in the population of lateral intraparietal cortex (LIP) neurons that remap. Responses of neurons to their most preferred shape and least preferred shape are normalized and averaged. Solid lines indicate responses to most preferred shapes; dashed lines indicate responses to least preferred shape. A: responses of neurons selective for shape in the fixation task, aligned on stimulus onset. B: responses of neurons selective for shape in the single-step task, aligned on saccade onset. C: responses of all remapping neurons (selective and nonselective) in fixation task, aligned on stimulus onset. D: responses of all remapping neurons (selective and nonselective) in single-step task, aligned on saccade onset.
Fig. 8.
Fig. 8.
Response of a neuron selective in both fixation and single-step tasks. A: visual responses in the fixation task are aligned on stimulus onset (top) and remapped responses in single-step task are aligned on saccade onset (bottom). Outlined boxes indicate the 200-ms epochs during which average firing rates were measured. For the neuron shown, stimulus was turned off ∼154 ms (SD 29 ms) before saccade onset.
Fig. 9.
Fig. 9.
Population-level comparison of preference for shape in 2 tasks. For each neuron, responses to each shape in a given task were divided by the response to the most preferred shape in that task. The resulting normalized responses to each shape in the single-step task are plotted as a function of the normalized responses in the fixation task. A: comparison of preferences in neurons that were selective in both tasks. B: comparison of preferences for all remapping neurons. FR, firing rate.
Fig. 10.
Fig. 10.
Population-level comparison of strength of selectivity between fixation and single-step task. Two selectivity measures were computed. A and B: SI for each neuron in the single-step task is plotted as a function of SI for that neuron in the fixation task. C and D: DOS for each neuron in the single-step task is plotted as a function of SI for that neuron in the fixation task. In A and C, SI and DOS of neurons selective in both tasks are compared. In B and D, the strength of selectivity of all neurons is compared.

References

    1. Andersen RA, Snyder LH, Bradley DC, Xing J. Multimodal representation of space in the posterior parietal cortex and its use in planning movements. Annu Rev Neurosci 20: 303–330, 1997 - PubMed
    1. Barash S, Bracewell RM, Fogassi L, Gnadt JW, Andersen RA. Saccade-related activity in the lateral intraparietal area. I. Temporal properties; comparison with area 7a. J Neurophysiol 66: 1095–1108, 1991a - PubMed
    1. Barash S, Bracewell RM, Fogassi L, Gnadt JW, Andersen RA. Saccade-related activity in the lateral intraparietal area. II. Spatial properties. J Neurophysiol 66: 1109–1124, 1991b - PubMed
    1. Bennur S, Gold JI. Distinct representations of a perceptual decision and the associated oculomotor plan in the monkey lateral intraparietal area. J Neurosci 31: 913–921, 2011 - PMC - PubMed
    1. Berman R, Colby C. Attention and active vision. Vision Res 49: 1233–1248, 2009 - PMC - PubMed

Publication types

LinkOut - more resources