. 2014 Jan;122(1):65-72.
doi: 10.1289/ehp.1306518. Epub 2013 Nov 13.

Evaluating multipollutant exposure and urban air quality: pollutant interrelationships, neighborhood variability, and nitrogen dioxide as a proxy pollutant

Affiliations

Evaluating multipollutant exposure and urban air quality: pollutant interrelationships, neighborhood variability, and nitrogen dioxide as a proxy pollutant

Ilan Levy et al. Environ Health Perspect. 2014 Jan.

Abstract

Background: Although urban air pollution is a complex mix containing multiple constituents, studies of the health effects of long-term exposure often focus on a single pollutant as a proxy for the entire mixture. A better understanding of the component pollutant concentrations and interrelationships would be useful in epidemiological studies that exploit spatial differences in exposure by clarifying the extent to which measures of individual pollutants, particularly nitrogen dioxide (NO2), represent spatial patterns in the multipollutant mixture.

Objectives: We examined air pollutant concentrations and interrelationships at the intraurban scale to obtain insight into the nature of the urban mixture of air pollutants.

Methods: Mobile measurements of 23 air pollutants were taken systematically at high resolution in Montreal, Quebec, Canada, over 34 days in the winter, summer, and autumn of 2009.

Results: We observed variability in pollution levels and in the statistical correlations between different pollutants according to season and neighborhood. Nitrogen oxide species (nitric oxide, NO2, nitrogen oxides, and total oxidized nitrogen species) had the highest overall spatial correlations with the suite of pollutants measured. Ultrafine particles and hydrocarbon-like organic aerosol concentration, a derived measure used as a specific indicator of traffic particles, also had very high correlations.

Conclusions: Our findings indicate that the multipollutant mix varies considerably throughout the city, both in time and in space, and thus, no single pollutant would be a perfect proxy measure for the entire mix under all circumstances. However, based on overall average spatial correlations with the suite of pollutants measured, nitrogen oxide species appeared to be the best available indicators of spatial variation in exposure to the outdoor urban air pollutant mixture.


Conflict of interest statement

The authors declare they have no actual or potential competing financial interests.

Figures

Figure 1
Figure 1
(A) Map of the study area showing land use types and CRUISER’s east (blue) and west (red) routes. (B) Higher resolution map showing the three neighborhoods of Anjou, Riviere des Prairies, and Point aux Tremble and major roads/highways, land use types, major emission sources, and CRUISER’s stop sites for the smaller area outlined in A. (C) The density of measurements per kilometer of road segment (measurements/km) based on all measurements combined.
Figure 2
Figure 2
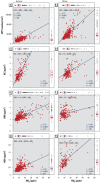
Scatter plots of UFP (A,B), BC (C,D), OM (E,F), and HOA (G,H) vs. NO2 (x-axes) for summer and winter measurements, with box plots on the top edge of each panel indicating the distribution of measurement data for NO2, and box plots on the right edge of each panel indicating the distribution of measurement data for the other pollutants. Each point in the scatter plots represents the average measurement at a road segment with ≥ 100 measurements/km on ≥ 3 days. Box plots indicate the mean (red square), median (blue line), high and low quartiles (outer red box), 1.5-IQR range (whiskers) and outliers (points). rp is the Pearson’s correlation coefficient, p is the p-values of the correlation, and n is the sample size. The variation in n between seasons and pollutant pairs is due to varying numbers of measurement days and rates of data loss (i.e., due to quality assurance/quality control procedures and our criteria for data completeness for each segment). The equation at the top of each panel is the linear regression fit of the two pollutants, with the slope and intercept of each pair.
Figure 3
Figure 3
Pearson correlation coefficients for pairs of pollutants for all measurement days combined (A; 34 measurement days), and for measurement days in the autumn (B; 6 days), summer (C; 17 days), and winter (D; 11 days), with nonsignificant correlations (p > 0.05) indicated by a black dot, and the magnitude of each correlation indicated on the color bar to the right. Numeric data corresponding to A–D are provided in Supplemental Material, Tables S2–S5. (E) Ratios of mean pollutant levels measured in the summer and winter compared with mean values based on all measurement days combined, and ratios of mean pollutant levels measured in the winter compared with the summer.
Figure 4
Figure 4
Pearson correlation coefficients between pairs of pollutants according to neighborhood [Anjou, Riviere des Prairies (RdP), and Point aux Tremble (PaT)] for selected pollutants [NO2 (A), NOx (B), NOY (C), PM10 (D), PM2.5 (E), UFP (F), BC (G), SO2 (H), and HOA (I)] and mean absolute values of correlations between the selected pollutants and all other pollutants measured (ravg) according to neighborhood for all measurement days combined. (J) Ratios of the average correlations for each pollutant with all other pollutants in each neighborhood to the average correlation for the same pollutant with all other pollutant over the entire study area. All data are based on all measurement days combined. Nonsignificant correlations (p > 0.05) are indicated by a black dot, and the magnitude of each correlation or ratio is indicated on the color bar to the right.

References

    1. Bergeron O, Strachan IB.2012Wintertime radiation and energy budget along an urbanization gradient in Montreal, Canada. Int J Climatol 32137–152.; 10.1002/joc.2246 - DOI
    1. Billionnet C, Sherrill D, Annesi-Maesano I.2012Estimating the health effects of exposure to multi-pollutant mixture. Ann Epidemiol 22126–141.; 10.1016/j.annepidem.2011.11.004 - DOI - PubMed
    1. Brook JR, Burnett RT, Dann TF, Cakmak S, Goldberg MS, Fan X, et al. Further interpretation of the acute effect of nitrogen dioxide observed in Canadian time-series studies. J Expos Sci Environ Epidemiol. 2007;17:S36–S44. - PubMed
    1. Crouse DL, Goldberg MS, Ross NA, Chen H, Labrèche F.2010Postmenopausal breast cancer is associated with exposure to traffic-related air pollution in Montreal, Canada: a case–control study. Environ Health Perspect 1181578–1583.; 10.1289/ehp.1002221 - DOI - PMC - PubMed
    1. Dobbin NA, Wheeler AJ, Smargiassi A, Bartlett S, Liu L, Shutt R, et al. Lung inflammation among children with asthma exposed to industrial and traffic pollution [Abstract 936]. In: 23rd Annual Conference of the International Society for Environmental Epidemiology (ISEE), 13–16 September 2011, Barcelona, Spain. 2011. Available: http://ehp.niehs.nih.gov/isee/PDF/isee11Abstract00936.pdf [accessed 3 December 2013]

Publication types

MeSH terms