Randomized Controlled Trial
. 2013 Nov 13;33(46):18080-6.
doi: 10.1523/JNEUROSCI.2764-13.2013.

Cortical reorganization after long-term adaptation to retinal lesions in humans

Affiliations
Randomized Controlled Trial

Cortical reorganization after long-term adaptation to retinal lesions in humans

Susana T L Chung. J Neurosci. .

Abstract

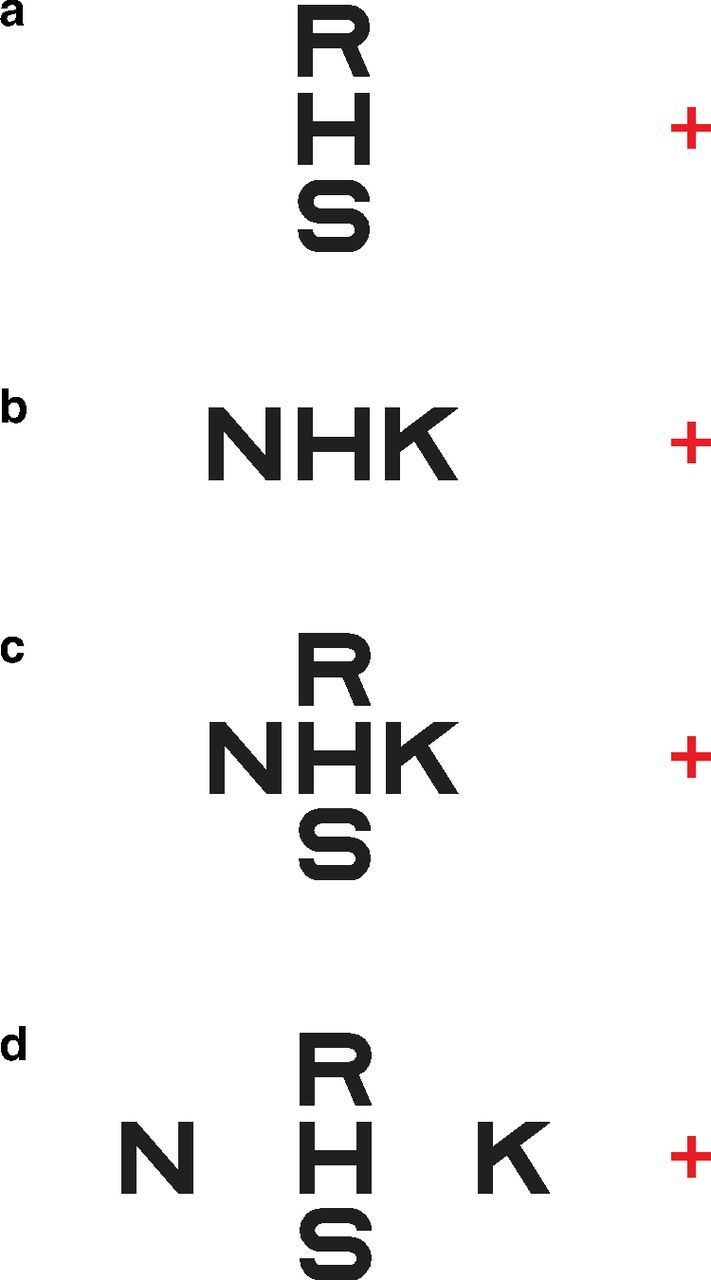
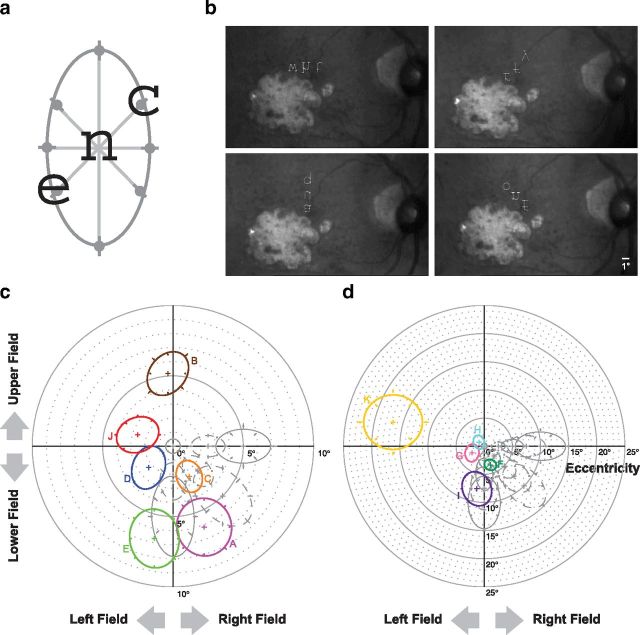
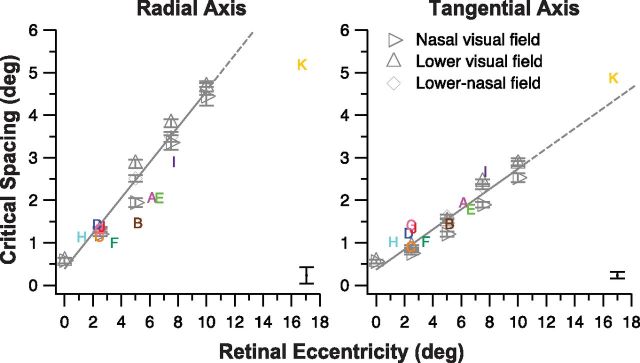
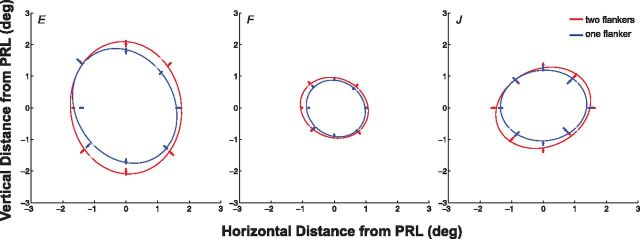
Single-unit recordings demonstrated that the adult mammalian visual cortex is capable of reorganizing after induced retinal lesions. In humans, whether the adult cortex is capable of reorganizing has only been studied using functional magnetic resonance imaging, with equivocal results. Here, we exploited the phenomenon of visual crowding, a major limitation on object recognition, to show that, in humans with long-standing retinal (macular) lesions that afflict the fovea and thus use their peripheral vision exclusively, the signature properties of crowding are distinctly different from those of the normal periphery. Crowding refers to the inability to recognize objects when the object spacing is smaller than the critical spacing. Critical spacing depends only on the retinal location of the object, scales linearly with its distance from the fovea, and is approximately two times larger in the radial than the tangential direction with respect to the fovea, thus demonstrating the signature radial-tangential anisotropy of the crowding zone. Using retinal imaging combined with behavioral measurements, we mapped out the crowding zone at the precise peripheral retinal locations adopted by individuals with macular lesions as the new visual reference loci. At these loci, the critical spacings are substantially smaller along the radial direction than expected based on the normal periphery, resulting in a lower scaling of critical spacing with the eccentricity of the peripheral locus and a loss in the signature radial-tangential anisotropy of the crowding zone. These results imply a fundamental difference in the substrate of cortical processing in object recognition following long-term adaptation to macular lesions.


Figures

Figure 1.
Figure 1.
While fixating the red cross in a, adjust the viewing distance until you can barely recognize the letter H on the left of the red fixation cross. The two flanking letters R and S are above and below the letter H, and the three letters form a line that is tangential with respect to fixation (presumably where your fovea is). Now shift your fixation to b, you should find it impossible to recognize the letter H, despite that the letter H is at the same distance with respect to the fixation cross as in a. In this case, the two flanking letters N and K are the same distance from H, as R and S are in a; however, when the letters N, H, and K form a line that is radial to fixation, this distance is not sufficient to allow H to be perceived clearly. c shows that, when four flanking letters R, K, S, and N are separated from H by the same distance, the letter H cannot be perceived clearly; however, when the two flanking letters that are radial with respect to the fovea (N and K) are separated from H by a larger distance, then the letter H can be perceived clearly (d). d clearly illustrates that the critical spacing between an object and its closest neighbor (the flanker) depends also on the direction of the flankers with respect to the object.
Figure 2.
Figure 2.
a, A schematic figure showing that the critical spacing was determined along four meridians (0°, 45°, 90°, and 135° from horizontal), and an ellipse was fit to the set of data. For illustration purpose, three letters, c, n, and e, are presented along the 45° meridian, with n being the target letter and is shown at the intended retinal location for testing. Observers verbally reported the identity of the target letter after the offset of the three letters. The spacing between letters that yielded 52% correct on the psychometric function [half-way between chance (1 of 26) and perfect performance] was defined as the threshold critical spacing (represented by the gray circles). b, Samples of the pictures of the retina of observer F showing trials in which the three letters of a trigram were oriented along the horizontal (top left), 45° diagonal (top right), vertical (bottom left), and 135° diagonal (bottom right) meridians, at locations close to the lesioned areas (the lighter colored regions, representing the non-seeing scotoma when projected in the visual field domain). These samples were extracted directly from the video recording of several experimental trials in which the stimulus letters were combined with the pictures of the retina before recording, thus explaining the quality of the letters. In reality, the letters were much clearer when presented to observers during testing. The middle letter of each trigram was the target letter to which observers were asked to verbally respond. The averaged retinal location corresponding to the center of the target letter was used to represent the PRL. Although the letters were displayed as upside down in the figure, observers saw the letters as upright within the SLO. The scale bar is given in the bottom right corner of the bottom right panel. c, A polar plot showing the two-dimensional shapes of the crowding zones for six observers with macular lesions (observers A–E and J). The threshold critical spacings for each observer are plotted as different colored symbols. Error bars represent ±1 SE for these data. We used bootstrap resampling to fit an ellipse to each set of data from which we derived the major and minor axis and the orientation of the ellipse. Each ellipse shown here was reconstructed based on the average value of these parameters after 1000 resamplings. For comparison, the crowding zones obtained at the fovea (center of the plot) and at 2.5°, 5°, 7.5°, and 10° in the nasal (plotted as the right field in the figure), lower, and lower-nasal visual fields of older adults with normal vision (control) are shown in gray. Solid and dashed ellipses represent data from the two groups of control older adults (4 in each group). For the control observers, error bars represent ±1 SD of the group values. Each crowding zone is centered at the PRL of an observer with macular lesions or at the intended retinal location for the control observers. d, A second polar plot showing the two-dimensional shapes of the crowding zones for the other five observers with macular lesions (observers F–I and K). Details of the plot are the same as for c. Note the change in scale of the plot.
Figure 3.
Figure 3.
Critical spacing (in degrees) along the radial and tangential axes of the fitted ellipses as shown in Figure 2, c and d, are plotted as a function of retinal eccentricity (also in degrees) of the PRL, for the 11 observers with macular lesions (colored letters). To avoid clutter, only the largest error (derived from the bootstrap resampling of fitting an ellipse to each set of critical spacing data) among the 11 observers is shown here, plotted as the error bar in the bottom right corner of each panel. For comparison, the critical spacing along the radial and tangential axes of the fitted ellipses that describe the crowding zones for the control observers (averaged across data from 1 of the 2 groups of 4 older adults with normal vision) are plotted as gray open symbols. The solid gray line in each panel represents the best-fit regression line to the data of the control observers and is extended (shown in dashes) beyond a retinal eccentricity of 10° (the highest eccentricity we had measured for our control observers). Across observers with macular lesions, the critical spacing along the tangential axis falls well along the fitted line based on the normal periphery, implying that the critical spacing at the PRL for these observers are similar to the predicted values based entirely on the retinal eccentricity. However, the critical spacing along the radial axis is smaller than the predicted value based entirely on the retinal eccentricity for more than half of the observers.
Figure 4.
Figure 4.
The critical spacings along eight meridians, representing the two-dimensional crowding zone, are compared between two conditions for three observers with macular lesions (observers E, F, and J). The two conditions were as follows: (1) two flankers were presented along a given meridian and the distance between either one of them and the target was yoked (the main experiment); and (2) only one flanker was presented. Each set of eight critical spacings was fit with an ellipse. The center of each panel [coordinate (0,0)] represents the location of the PRL. Error bars represent ±1 SE of the estimate of the critical spacing.

Similar articles

Cited by

References

    1. Baker CI, Peli E, Knouf N, Kanwisher NG. Reorganization of visual processing in macular degeneration. J Neurosci. 2005;25:614–618. doi: 10.1523/JNEUROSCI.3476-04.2005. - DOI - PMC - PubMed
    1. Baker CI, Dilks DD, Peli E, Kanwisher N. Reorganization of visual processing in macular degeneration: replication and clues about the role of foveal loss. Vision Res. 2008;48:1910–1919. doi: 10.1016/j.visres.2008.05.020. - DOI - PMC - PubMed
    1. Baseler HA, Gouws A, Haak KV, Racey C, Crossland MD, Tufail A, Rubin GS, Cornelissen FW, Morland AB. Large-scale remapping of visual cortex is absent in adult humans with macular degeneration. Nat Neurosci. 2011;14:649–655. doi: 10.1038/nn.2793. - DOI - PubMed
    1. Bi T, Cai P, Zhou T, Fang F. The effect of crowding on orientation-selective adaptation in human early visual cortex. J Vis. 2009;9(11):13, 1–10. doi: 10.1167/9.11.13. - DOI - PubMed
    1. Bouma H. Interaction effects in parafoveal letter recognition. Nature. 1970;226:177–178. doi: 10.1038/226177a0. - DOI - PubMed

Publication types