Randomized Controlled Trial
. 2013 Nov 13;33(46):18109-24.
doi: 10.1523/JNEUROSCI.1741-13.2013.

Longitudinal growth curves of brain function underlying inhibitory control through adolescence

Affiliations
Randomized Controlled Trial

Longitudinal growth curves of brain function underlying inhibitory control through adolescence

Sarah J Ordaz et al. J Neurosci. .

Abstract

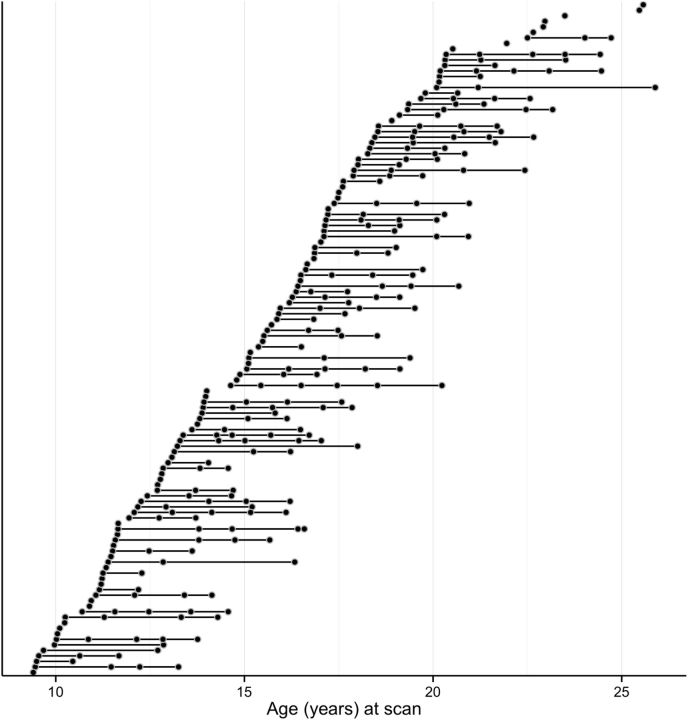
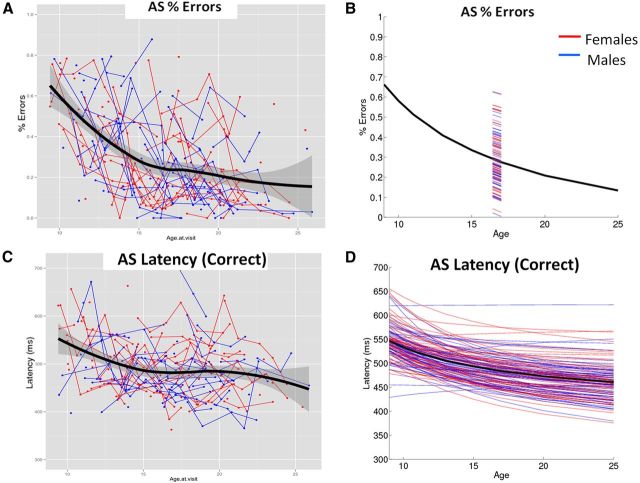
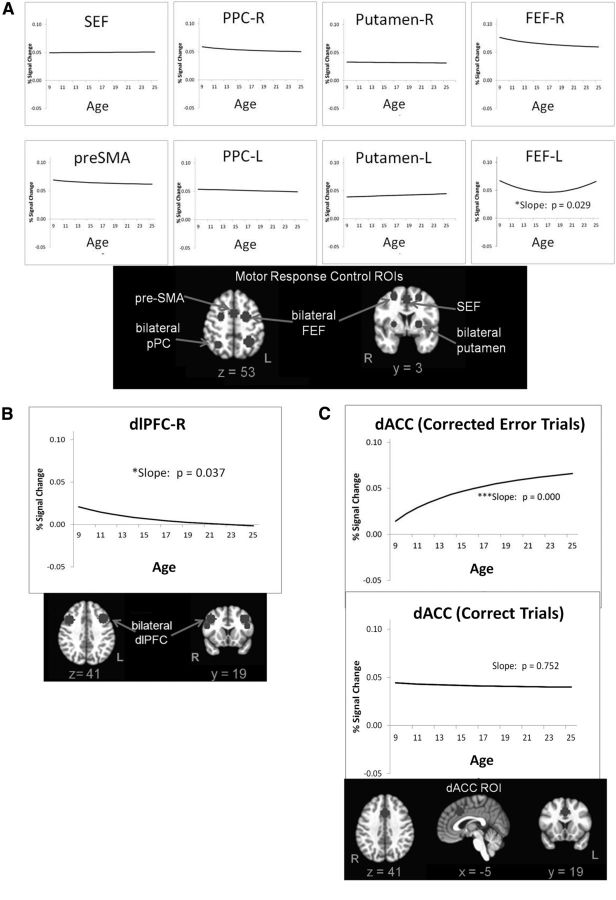
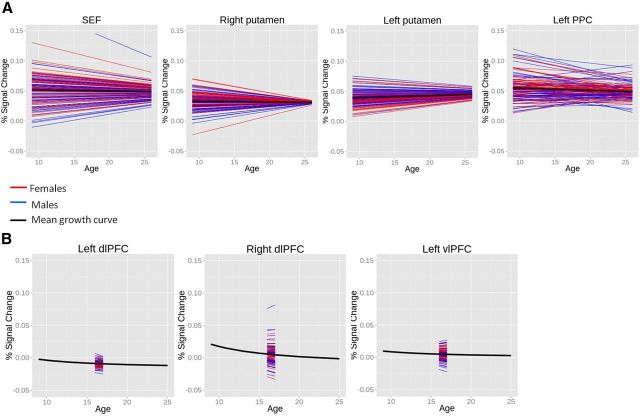
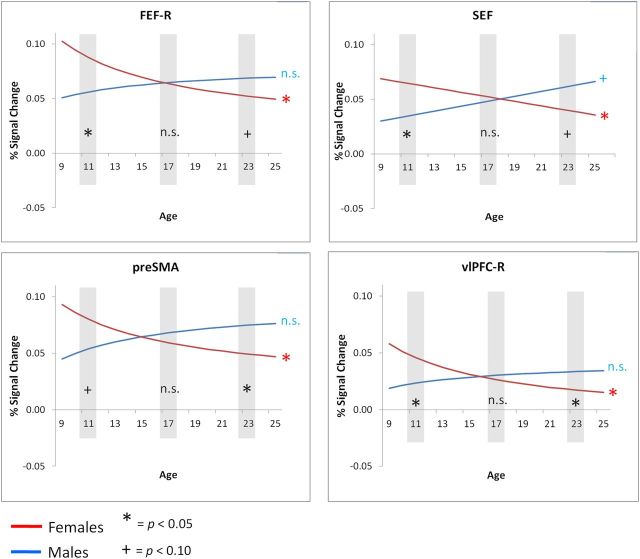
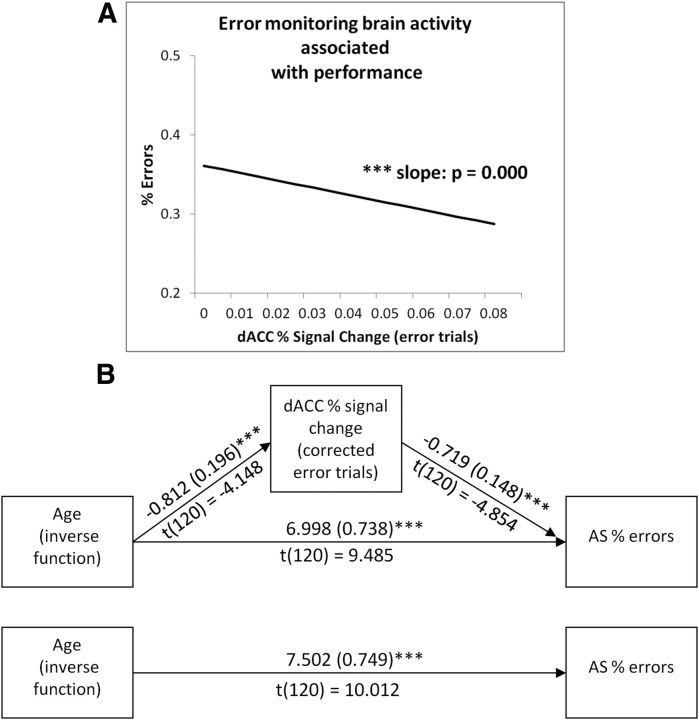
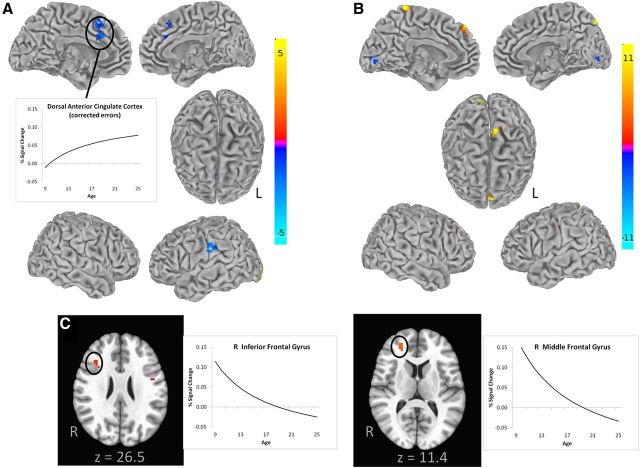
Neuroimaging studies suggest that developmental improvements in inhibitory control are primarily supported by changes in prefrontal executive function. However, studies are contradictory with respect to how activation in prefrontal regions changes with age, and they have yet to analyze longitudinal data using growth curve modeling, which allows characterization of dynamic processes of developmental change, individual differences in growth trajectories, and variables that predict any interindividual variability in trajectories. In this study, we present growth curves modeled from longitudinal fMRI data collected over 302 visits (across ages 9 to 26 years) from 123 human participants. Brain regions within circuits known to support motor response control, executive control, and error processing (i.e., aspects of inhibitory control) were investigated. Findings revealed distinct developmental trajectories for regions within each circuit and indicated that a hierarchical pattern of maturation of brain activation supports the gradual emergence of adult-like inhibitory control. Mean growth curves of activation in motor response control regions revealed no changes with age, although interindividual variability decreased with development, indicating equifinality with maturity. Activation in certain executive control regions decreased with age until adolescence, and variability was stable across development. Error-processing activation in the dorsal anterior cingulate cortex showed continued increases into adulthood and no significant interindividual variability across development, and was uniquely associated with task performance. These findings provide evidence that continued maturation of error-processing abilities supports the protracted development of inhibitory control over adolescence, while motor response control regions provide early-maturing foundational capacities and suggest that some executive control regions may buttress immature networks as error processing continues to mature.


Figures

Figure 1.
Figure 1.
Age distribution of the data reveals consistent sampling throughout the age range represented in final statistical models. Each black circle denotes a scan acquisition that was included in the final analyses, and multiple scans for a single participant are denoted by a line interconnecting multiple black circles. For each participant, the leftmost circle denotes the age at the first scan.
Figure 2.
Figure 2.
A, B, Depiction of experimental run structures (A) and task trial structures (B). From Velanova et al. (2008), used with permission.
Figure 3.
Figure 3.
Main effect of time maps from all participants in this sample, shown in radiological view and thresholded at p < 0.001, indicate robust activation in regions known to be associated with AS performance. To avoid overestimating activation, only one randomly selected visit per participant is depicted. A, Axial images of the AS correct with a fixation baseline comparison indicate engagement of motor response control and the executive control system, with an additional coronal image highlighting right dlPFC activation. B, Axial and mid-sagittal images of AS-corrected errors with a fixation baseline comparison corroborate expected activation in the dorsal anterior cingulate cortex. R, Right.
Figure 4.
Figure 4.
A, C, Raw behavioral data with superimposed loess lines corroborate selection of inverse functions to model mean growth curves (right; black). B, Since results indicated significant variance in intercepts but not slopes for AS-corrected error rates, the mean growth curve is plotted along with a portion of each individual's estimated regression line. D, For AS latencies, results indicated significant variability in both intercepts and slopes, so each individual's full estimated regression line is plotted.
Figure 5.
Figure 5.
A, Mean growth curves for motor response control ROIs (shown below graphs in radiological view) consistently indicate no developmental change in activation, with one exception noted. B, Mean growth curves for executive control regions indicate that only the right dlPFC demonstrates developmental changes in activation, as illustrated below. C, Mean growth curve for error processing (dACC during corrected error trials) indicates increases in the percentage of signal change with age. This effect is specific to error-related activation, as indicated by a lack of significant age-related change in the dACC during correct trials.
Figure 6.
Figure 6.
A, Variability declines with age in a subset of motor response control regions, including the SEF, bilateral putamen, and left pPC. B, Parallel trajectories in executive control regions. Dashed lines indicate significant variability in intercepts, but not in slopes, and convey the range of interindividual variability in brain activation at all ages.
Figure 7.
Figure 7.
Sex effects in trajectories exist predominantly in motor response control regions. Red and blue symbols denote whether there is significant age-related change for each sex. Black symbols indicate the significance of sex differences at ages 11, 16.7, and 23 years, ages selected a priori to reflect different stages of development.
Figure 8.
Figure 8.
A, Increased activation in the dACC during corrected error trials is associated with better overall task performance, as indicated by lower AS error rates. B, Percentage of signal change in the dACC during corrected error trials mediates the effect of age (modeled as an inverse function) on AS error rates, as indicated by the product of coefficients test (MacKinnon et al., 2002).
Figure 9.
Figure 9.
Results from voxelwise HLM analyses. All maps are based on the inverse age model, which was the best-fitting regression for all voxels during both correct trials and corrected error trials. A–C, Statistical maps for activation associated with AS-corrected error trials (A) and AS correct trials (B, C) illustrate regression coefficients for the slope term, in voxels that surpassed a thresholded t value and after cluster correction. Axial slices in C serve to highlight areas not readily evident from AS correct trials cortical surface maps. These illustrate activation in the right inferior frontal gyrus (z = 26.5, left image) and right middle frontal gyrus (z = 11.4, right image). In the dACC (A) and selected prefrontal clusters (C), trajectories determined by the average intercept and slope values for a given cluster are displayed.

References

    1. Aron AR, Robbins TW, Poldrack RA. Inhibition and the right inferior frontal cortex. Trends Cogn Sci. 2004;8:170–177. doi: 10.1016/j.tics.2004.02.010. - DOI - PubMed
    1. Asato MR, Terwilliger R, Woo J, Luna B. White matter development in adolescence: a DTI study. Cereb Cortex. 2010;20:2122–2131. doi: 10.1093/cercor/bhp282. - DOI - PMC - PubMed
    1. Bava S, Boucquey V, Goldenberg D, Thayer RE, Ward M, Jacobus J, Tapert SF. Sex differences in adolescent white matter architecture. Brain Res. 2011;1375:41–48. doi: 10.1016/j.brainres.2010.12.051. - DOI - PMC - PubMed
    1. Benjamini Y, Hochberg Y. Controlling the false discovery rate: a practical and powerful approach to multiple testing. J R Stat Soc Series B Stat Methodol. 1995;57:289–300.
    1. Bennett CM, Miller MB. How reliable are the results from functional magnetic resonance imaging? Ann N Y Acad Sci. 2010;1191:133–155. doi: 10.1111/j.1749-6632.2010.05446.x. - DOI - PubMed

Publication types

LinkOut - more resources