. 2013 Nov 13;33(46):18175-89.
doi: 10.1523/JNEUROSCI.4933-12.2013.

Tau pathology is present in vivo and develops in vitro in sensory neurons from human P301S tau transgenic mice: a system for screening drugs against tauopathies

Affiliations

Tau pathology is present in vivo and develops in vitro in sensory neurons from human P301S tau transgenic mice: a system for screening drugs against tauopathies

Manuela Mellone et al. J Neurosci. .

Abstract

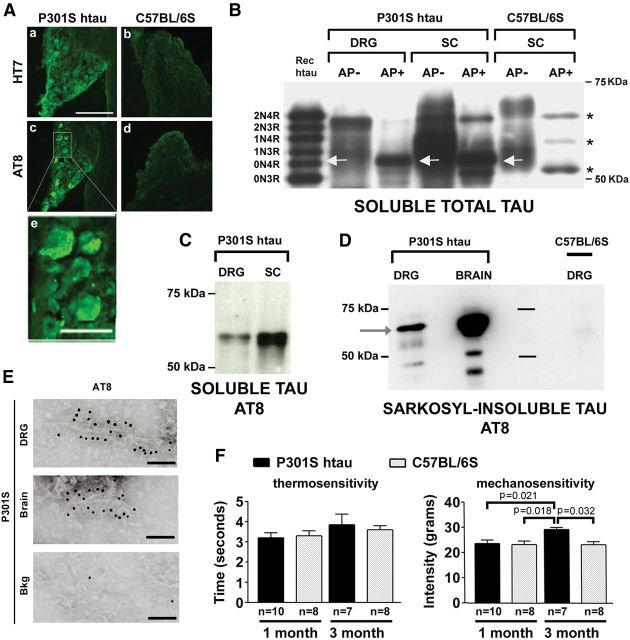
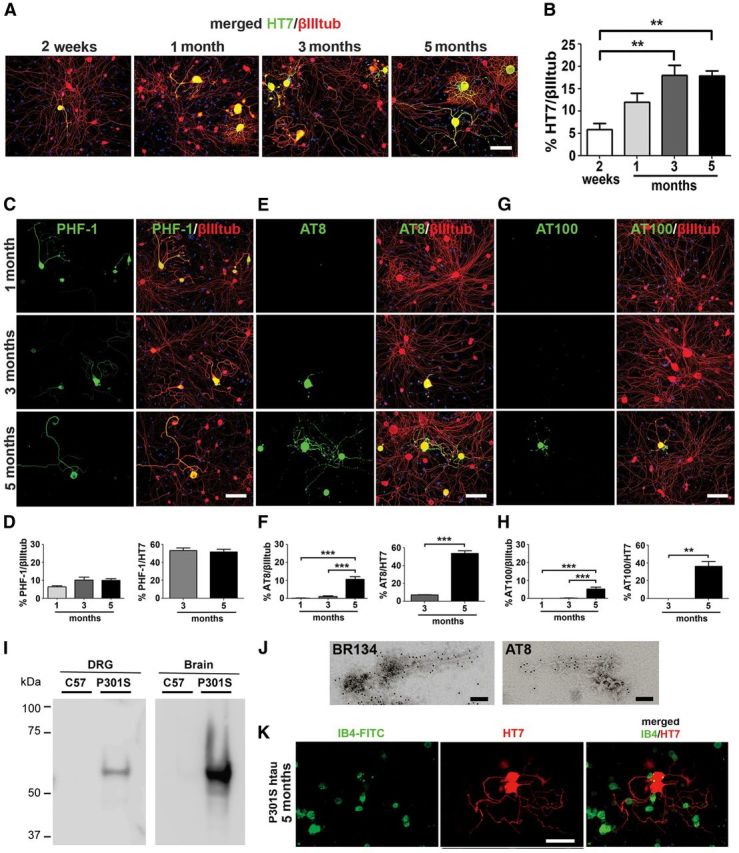
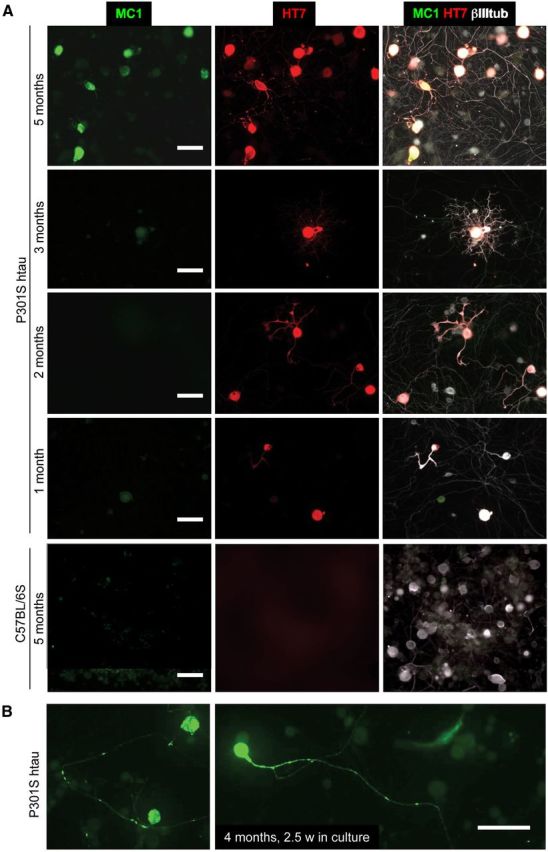
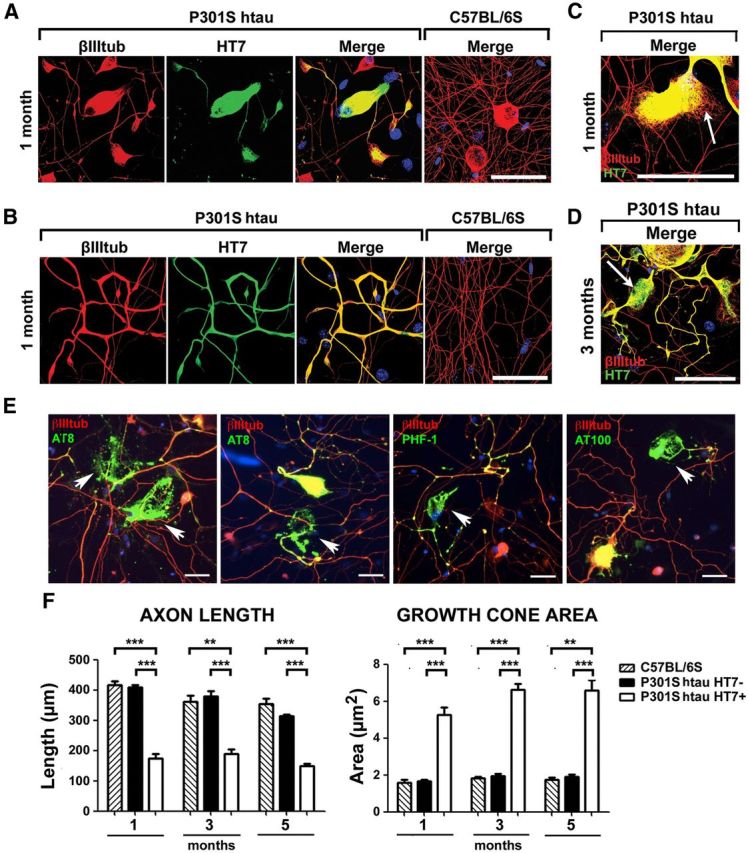
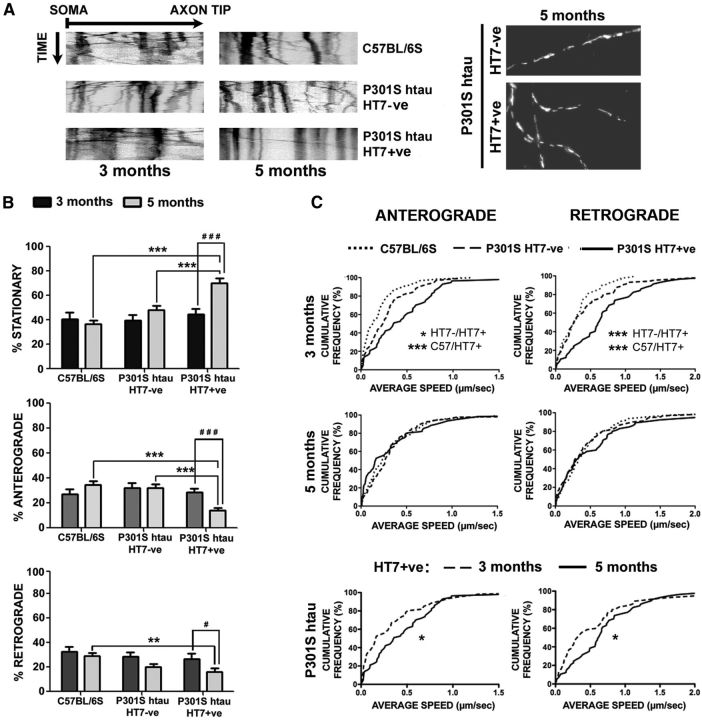
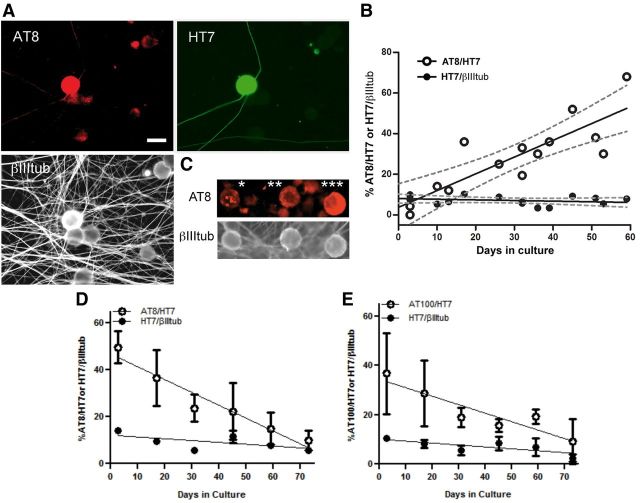
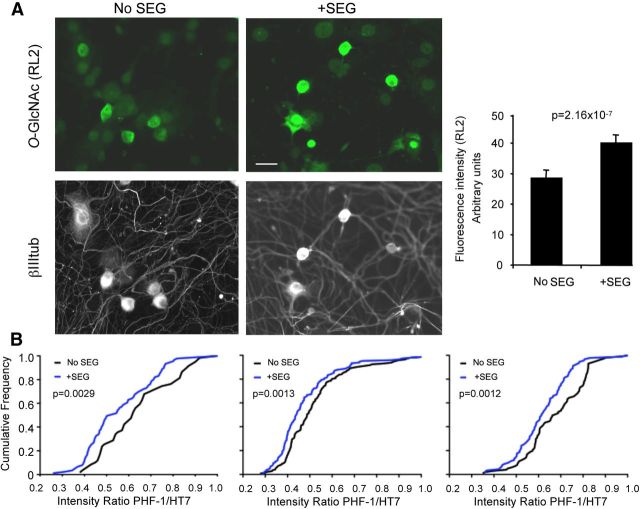
Intracellular tau aggregates are the neuropathological hallmark of several neurodegenerative diseases, including Alzheimer's disease, progressive supranuclear palsy, and cases of frontotemporal dementia, but the link between these aggregates and neurodegeneration remains unclear. Neuronal models recapitulating the main features of tau pathology are necessary to investigate the molecular mechanisms of tau malfunction, but current models show little and inconsistent spontaneous tau aggregation. We show that dorsal root ganglion (DRG) neurons in transgenic mice expressing human P301S tau (P301S-htau) develop tau pathology similar to that found in brain and spinal cord and a significant reduction in mechanosensation occurs before detectable fibrillar tau formation. DRG neuronal cultures established from adult P301S-htau mice at different ages retained the pattern of aberrant tau found in vivo. Moreover, htau became progressively hyperphosphorylated over 2 months in vitro beginning with nonsymptomatic neurons, while hyperphosphorylated P301S-htau-positive neurons from 5-month-old mice cultured for 2 months died preferentially. P301S-htau-positive neurons grew aberrant axons, including spheroids, typically found in human tauopathies. Neurons cultured at advanced stages of tau pathology showed a 60% decrease in the fraction of moving mitochondria. SEG28019, a novel O-GlcNAcase inhibitor, reduced steady-state pSer396/pSer404 phosphorylation over 7 weeks in a significant proportion of DRG neurons showing for the first time the possible beneficial effect of prolonged dosing of O-GlcNAcase inhibitor in vitro. Our system is unique in that fibrillar tau forms without external manipulation and provides an important new tool for understanding the mechanisms of tau dysfunction and for screening of compounds for treatment of tauopathies.


Figures

Figure 1.
Figure 1.
DRG neurons in P301S-htau mice contain hyperphosphorylated tau, NFTs, and an associated mechanosensory deficit. A, Sections (12 μm) from DRGs of 5-month-old P301S-htau and C57BL/6S control mice were stained with anti-htau (HT7; a and b) or anti-phospho-tau (AT8; c–e) and visualized by fluorescence microscopy. The detail (e) shows typical ring and crescent-like shapes formed by pathological htau. Scale bars: A, a–d, 200 μm; A, e, 50 μm. B, Perchloric acid-soluble protein extracts from P301S-htau DRG and spinal cord (SC) separated by SDS-PAGE alongside a SC extract from a control animal. Half of each sample was treated with alkaline phosphatase (AP+). Blots were probed with anti-total tau antibody (Dako); white arrows: dephosphorylated P301S-htau aligned with recombinant 0N4R htau band; *, murine tau isoforms. C, Hyperphosphorylation at pS202/pT205 detected with AT8 in perchloric acid-soluble tau extracts. D, Sarkosyl-insoluble tau prepared from DRGs from 5-month-old P301S-htau or control mice and a P301S-htau mouse brain probed with AT8. No insoluble tau is present in the control sample while a 64 kDa band (arrow) is present in DRG and brain of P301S htau mice. E, Immunogold EM of the sarkosyl-insoluble tau from DRGs probed with AT8 antibody shows the presence of tau filaments. Bkg, background immunogold labeling. No filaments were observed in extracts from control mice. Scale bars: 100 nm. F, Sensory tests in P301S-htau and C57BL/6S mice at 1 and 3 months of age show no alterations in thermal sensitivity (left) but a significant change in mechanosensitivity, as shown by the pressure test (right), which is altered in 3-month-old P301S-htau mice [(mean ± SEM; n = 7–10; one-way ANOVA (p = 0.012) followed by Bonferroni post hoc adjustment p = 0.021 (P301S-1m/P301S-3m); p = 0.032 (P301S-3m/C57BL6-3m); p = 0.018 (P301S-3m/C57BL6-1m)].
Figure 2.
Figure 2.
Dissociated DRG neurons from P301S-htau mice at different ages develop progressive tau pathology. Dissociated DRG neurons were prepared from P301S-htau mice at 2 weeks and 1, 3, and 5 months of age, cultured for 2 DIV, and immunolabeled with the indicated anti-human tau (HT7) or anti-phospho-tau antibodies and anti-βIII tubulin antibody. A, Developmental profile of HT7+ve immunolabeling at 2 weeks and 1, 3, and 5 months. Note weak labeling of axons in sample cultured at 2 weeks and complex pattern of outgrowth in neurons cultured at 1, 3, and 5 months. B, The proportion of cells expressing P301S-htau (HT7+ve) out of the total βIII tubulin+ve neurons is shown as a function of mouse age (mean ± SEM, n = 6; one-way ANOVA (p = 0.003) followed by Bonferroni post hoc adjustment; p = 0.0086 (2w/3m); p = 0.0093 (2w/5m)). C, E, G, Dissociated DRG neurons cultured for 2 DIV from P301S-htau mice aged 1, 3, and 5 months, immunolabeled with the phosphorylation-dependent anti-tau antibodies PHF-1, AT8, and AT100. Scale bar, 100 μm. D, F, H, Quantification of the proportion of PHF-1/AT8/AT100+ve neurons out of the total βIII tubulin+ve neurons (n = 6), or HT7+ve neurons (n = 3–4). Mean ± SEM, one-way ANOVA followed by Bonferroni post hoc adjustment. F, AT8/βIII tubulin ANOVA p = 5.1 × 10⁻⁷; p = 0.0011 (1m/5m); p = 0.0017 (3m/5m); Student's t test; AT8/HT7 p = 0.0002. H, AT100/βIII tubulin ANOVA p = 1.2 × 10⁻⁵, p = 0.016 (1m/5m), p = 0.017 (3m/5m); Student's t test; AT100/HT7 p = 0.0012. I, Sarkosyl-insoluble tau was extracted from dissociated DRG neuron cultures (2 DIV) from 5-month-old P301S-htau or C57BL/6S mice and analyzed by immunoblotting using the HT7 antibody. Brain extracts from the same mice were used as positive controls. Note that the samples were run on the same blot but to visualize both sets of bands, the image on the left was exposed for 10 min whereas the image on the right was exposed for 1 min. J, Sarkosyl-insoluble tau was extracted from dissociated DRG neuron cultures (2 DIV) from 5-month-old mice and analyzed by immunogold EM with the phosphorylation-independent and phosphorylation-dependent anti-tau antibodies BR134 and AT8, respectively. Tau filaments from the cultured cells appear as straight or narrow twisted filaments and are similar to those found in DRG tissue from 5-month-old mice shown in Figure 1. Scale bars: 100 nm. K, DRG neurons from 3-month-old P301S-htau mice were cultured for 2 d, fixed, and stained with IB4-FITC (green) and HT7 (red), and imaged by fluorescence microscopy. Note lack of overlap between the two probes.
Figure 3.
Figure 3.
MC1 reactivity develops in culture at a late stage of pathology. A, DRG neurons cultured for 2 DIV from 1-, 2-, 3-, and 5-month-old P301S-htau or 5-month-old C57BL/6S mice were stained with antibody MC1 (green), HT7 (red); merged images also show labeling for βIII tubulin (white). B, DRG neurons from 4-month-old mice stained with MC1 (green). Note MC1-positive aggregates in the axons and cell bodies, Scale bars: 50 μm.
Figure 4.
Figure 4.
Cultured P301S-htau-expressing DRG neurons display early morphological abnormalities. Low-density dissociated DRG cultures were grown for 2 DIV, fixed, and immunolabeled with HT7 and anti-βIII tubulin antibodies. A–C, Enlarged and stunted growth cones with splayed MTs and thickened, looped, and bent axons are present in neurons from 1-month-old P301S-htau mouse but not C57BL/6S control. D, A spheroid bulge in an axon from a 3-month-old mouse. Spheroids are often found in human tauopathy brains. E, Residual tangles of aggregated tau in degenerating cells with little or no βIII tubulin (red) or nuclear stain (blue) in cultures from 5-month-old mice. Arrows point to typical tau deposits that stain for PHF-1, AT8, or AT100 (green). Merged images were captured with a fluorescence microscope using a 20× objective. Scale bars: A–D, 50 μm; E, 20 μm. F, Quantification of axon length and growth cone area in cultures from 1-, 3-, and 5-month-old mice show reduction in axon length and an increase in growth cone area in DRGs with P301S-htau compared with DRG without htau (P301S-HT7−ve) or from C57BL/6S control mice (mean ± SEM, n = 3 for C57BL/6S cultures and n = 4 for P301S-htau cultures, two-way ANOVA followed by Bonferroni post hoc adjustment). (Axon length: ANOVA C57BL/6S/P301S-HT7−ve/P301S-HT7+ve p = 4.5 × 10⁻⁵, 1m/3m/5m p = 1 × 10⁻⁵, Interactions p = 0.0368; p = 0.0002 (1m C57BL/6S/ P301S-HT7+ve), p = 1.3 × 10⁻⁵ (1m P301S-HT7−ve/P301S-HT7+ve), p = 0.0025 (3m C57BL/6S/ P301S-HT7+ve), p = 0.0005 (3m P301S-HT7−ve/P301S-HT7+ve); p = 0.0003 (5m C57BL/6S/ P301S-HT7+ve), p = 1.2 × 10⁻⁵ (5m P301S-HT7−ve/P301S-HT7+ve); Growth cone area: ANOVA C57BL/6S/P301S-HT7−ve/P301S-HT7+ve p = 0.0256, 1m/3m/5m p = 5 × 10⁻⁴, p = 0.0009 (1m C57BL/6S/P301S-HT7+ve), p = 0.0008 (1m P301S-HT7−ve/P301S-HT7+ve), p = 0.0002 (3m C57BL/6S/P301S-HT7+ve), p = 2.5 × 10⁻⁵ (3m P301S-HT7−ve/P301S-HT7+ve); p = 0.0018 (5m C57BL/6S/ P301S-HT7+ve), p = 0.0004 (5m P301S-HT7−ve/P301S-HT7+ve).
Figure 5.
Figure 5.
Mitochondrial movement is differentially altered in DRG neurons from P301S-htau mice. DRG neurons from 3-month-old or 5 month-old P301S-htau or C57BL/6S mice were cultured for 40 h, then incubated in medium containing 10 nm MitoTracker Orange for 5 min at 37°C just before imaging. P301S-htau+ve neurons were relocated after the experiment by immunolabeling with HT7 antibody. A, Representative time-lapse image series (1 frame every 5 s for 5 min) of C57BL/6S, P301S-htau HT7−ve, and P301S-htau HT7+ve neurons from 3- and 5-month-old mice converted into kymographs. Vertical tracks represent stationary mitochondria while oblique tracks depict the moving organelles. A typical snapshot of mitochondria in a P301S-htau HT7−ve and HT7+ve axon is shown to the right of the kymographs. Note that the density and shapes of polarized mitochondria in the axons are similar between the HT7−ve and HT7+ve neurons. B, Quantification of the proportion of stationary and moving mitochondria in the anterograde and retrograde directions (mean ± SEM, n = 11 axons from 3-month-old mice, n = 20 axons from 5-month-old mice; two-way ANOVA with Bonferroni post hoc adjustment; Stationary: ANOVA p = 5 × 10⁻⁷; p = 0.0006 (5m P301S-HT7+ve/5m P301S-HT7−ve), p = 5 × 10⁻⁷; (5m P301S-HT7+ve/5m C57BL/6S), p = 4.7 × 10⁻⁵ (5m P301S-HT7+ve/3m C57BL/6S), p = 0.1 × 10⁻⁷ ( (5m P301S-HT7+ve/3m P301S-HT7−ve), p = 5 × 10⁻⁷ (5m P301S-HT7+ve/3m P301S-HT7+ve), p = 0.0099 (5m P301S-HT7−ve/3m P301S-HT7−ve); Anterograde: ANOVA p = 2 × 10⁻⁶; p = 0.0003 (5m P301S-HT7+ve/5m P301S-HT7−ve), p = 2.1 × 10⁻⁵ (5m P301S-HT7+ve/5m C57BL/6S), p = 8 × 10⁻⁶ (5m P301S-HT7+ve/3m C57BL/6S), p = 0.0333 (5m P301S-HT7+ve/3m P301S-HT7+ve); Retrograde: ANOVA p = 0.0041, p = 0.0325 (5m P301S-HT7+ve/5m C57BL/6S), p = 0.0159 (5m P301S-HT7+ve/3m C57BL/6S), p = 0.0457. C, Analysis of cumulative anterograde and retrograde average velocity distributions. Cumulative distribution statistics: Anterograde: p = 0.0592 (3m C57BL/6S/3m P301S-HT7−ve), p = 2.5 × 10⁻⁵ (3m C57BL/6S/3m P301S-HT7+ve), p = 0.0221 (3m P301S-HT7−ve/3m P301S-HT7+ve); Retrograde: p = 0.7128 (3m C57BL/6S/3m P301S-HT7−ve), p = 1.12 × 10⁻⁵ (3m C57BL/6S/3m P301S-HT7+ve), p = 0.0008 (3m P301S-HT7−ve/3m P301S-HT7+ve); Average speed in both directions was increased in HT7+ve neurons from 3-month-old mice compared with HT7−ve neurons or C57BL/6S controls, but not in cultures from 5-month-old animals. The average speed of mitochondria in P301S-htau HT7+ve neurons from 3-month-old mice was also significantly greater than that from 5-month-old mice; p = 0.0199 (3m/5m P301S-HT7+ve Anterograde), p = 0.0418 (3m/5m P301S-HT7+ve Retrograde).
Figure 6.
Figure 6.
DRG neurons from P301S-htau mice develop tau pathology during long-term culture in vitro. A, Profile of a typical long-lived AT8+ve/HT7+ve DRG neuron cultured from 3-month-old mice after 8 weeks in vitro. B, DRG neurons cultured from 3-month-old P301S-htau mice were fixed at the days indicated, and the proportion of HT7+ve neurons out of the total βIII tubulin+ve neuron population (●), or the proportion of AT8+ve neurons out of the total HT7+ve population (○) was quantified. Each point is the mean value of replicates from one culture of three mice. The lines depict a linear regression and the dashed lines show the 95% confidence intervals. For ratio of HT7+ve/βIII tub+ve: R2 = 0.08, F test for slope being different from zero, p = 0.32 (not significant); for AT8/HT7+ve: R2 = 0.71, F test for slope being different from zero, p = 0.0002. C, Detail of three adjacent neurons stained with AT8 (red) and βIII tubulin (white) after 8 weeks, showing typical profiles of pathological tau: *, AT8+ve large cytoplasmic aggregates; **, AT8+ve small cytoplasmic aggregates; ***, AT8+ve cytoplasmic perinuclear crescent. D, E, DRG neurons from 5-month-old P301S-htau mice cultured for 73 d. Left, Quantification of the proportion of AT8+ve (D) and AT100+ve (E) neurons out of the total HT7+ve population (○), and the proportion of HT7+ve neurons out of the total βIII tubulin+ve neuron population (●). Each point shows the mean value ± SEM independent cultures from three to four mice except for the result at 73 d, which shows the average ± range from two mice. Points without error bars are because the errors were smaller than the size of the point. The lines depict a linear regression through the total cohort of raw values for each condition (17 data points). For ratio of AT8/HT7+ve: R2 = 0.36, F test for slope being different from zero, p = 0.0173; For overall ratio of AT100/HT7+ve: R2 = 0.19, F test for slope being different from zero, p = 0.0993; HT7+ve/βIII tub+ve in samples stained for AT8, p = 0.052; AT100, p = 0.062 (not significant).
Figure 7.
Figure 7.
The O-GlcNAcase inhibitor SEG28019 reduces PHF-1 immunoreactivity in DRG neurons. A, DRG neurons were cultured from 5-month-old P301S-htau mice for 6 d after which SEG28019 (SEG; 10 μm) was added for 22 h. Cells were fixed and stained for the presence of O-GlcNAc modification using the RL2 antibody (green) and anti-βIII tubulin (white) and visualized by fluorescence microscopy. Bar graph shows average cytoplasmic intensity of RL2 labeling from two independent cultures. Mean ± SEM, NoSEG28019, n = 91 neurons; +SEG28019, n = 151 neurons. ANOVA p = 1.48 × 10⁻¹⁵; t test, p = 2.16 × 10⁻⁷. Scale bar, 20 μm. B, DRG neurons were cultured from two different litters of 3-month-old P301S-htau mice. SEG28019 (10 μm) was added at day two and freshly added two times a week over 7 weeks. Cultures were fixed and stained with anti-phospho tau antibody PHF-1 and for human tau (HT7) and visualized by fluorescence microscopy. The intensity of PH-1 labeling was normalized to the intensity of HT7 labeling to offset fluctuations due to different amounts of htau expression. The graphs show the ratios plotted as fractional cumulative distribution plots for three independent cultures from litter a (left and middle) and litter b (right). Note that there is a higher fraction of neurons with lower PHF-1/HT7 intensity in the SEG28019-treated cultures compared with the nontreated cultures. Data were analyzed using a nonparametric Mann–Whitney test. Left plot, No SEG28019 n = 89, +SEG28019 n = 59, p = 0.0029. Middle plot, No SEG28019 n = 91, +SEG28019 n = 91, p = 0.0013. Right plot, No SEG28019 n = 150, + SEG28019 n = 146, p = 0.0012.

References

    1. Allen B, Ingram E, Takao M, Smith MJ, Jakes R, Virdee K, Yoshida H, Holzer M, Craxton M, Emson PC, Atzori C, Migheli A, Crowther RA, Ghetti B, Spillantini MG, Goedert M. Abundant tau filaments and nonapoptotic neurodegeneration in transgenic mice expressing human P301S tau protein. J Neurosci. 2002;22:9340–9351. - PMC - PubMed
    1. Alonso Adel C, Li B, Grundke-Iqbal I, Iqbal K. Polymerization of hyperphosphorylated tau into filaments eliminates its inhibitory activity. Proc Natl Acad Sci U S A. 2006;103:8864–8869. doi: 10.1073/pnas.0603214103. - DOI - PMC - PubMed
    1. Biernat J, Mandelkow EM, Schröter C, Lichtenberg-Kraag B, Steiner B, Berling B, Meyer H, Mercken M, Vandermeeren A, Goedert M, et al. The switch of tau protein to an Alzheimer-like state includes the phosphorylation of two serine-proline motifs upstream of the microtubule binding region. EMBO J. 1992;11:1593–1597. - PMC - PubMed
    1. Binder LI, Frankfurter A, Rebhun LI. The distribution of tau in the mammalian central nervous system. J Cell Biol. 1985;101:1371–1378. doi: 10.1083/jcb.101.4.1371. - DOI - PMC - PubMed
    1. MJ, Morris R, McArdle A, Jackson MJ, Thippeswamy T. The effects of L-NAME on neuronal NOS and SOD1 expression in the DRG-spinal cord network of axotomised Thy 1.2 eGFP mice. Neuron Glia Biol. 2011;7:129–141. doi: 10.1017/S1740925X12000051. - DOI - PubMed

Publication types

MeSH terms