. 2013 Nov 13;33(46):18208-18.
doi: 10.1523/JNEUROSCI.1931-13.2013.

Uncoupling of EphA/ephrinA signaling and spontaneous activity in neural circuit wiring

Affiliations

Uncoupling of EphA/ephrinA signaling and spontaneous activity in neural circuit wiring

Isabel Benjumeda et al. J Neurosci. .

Abstract

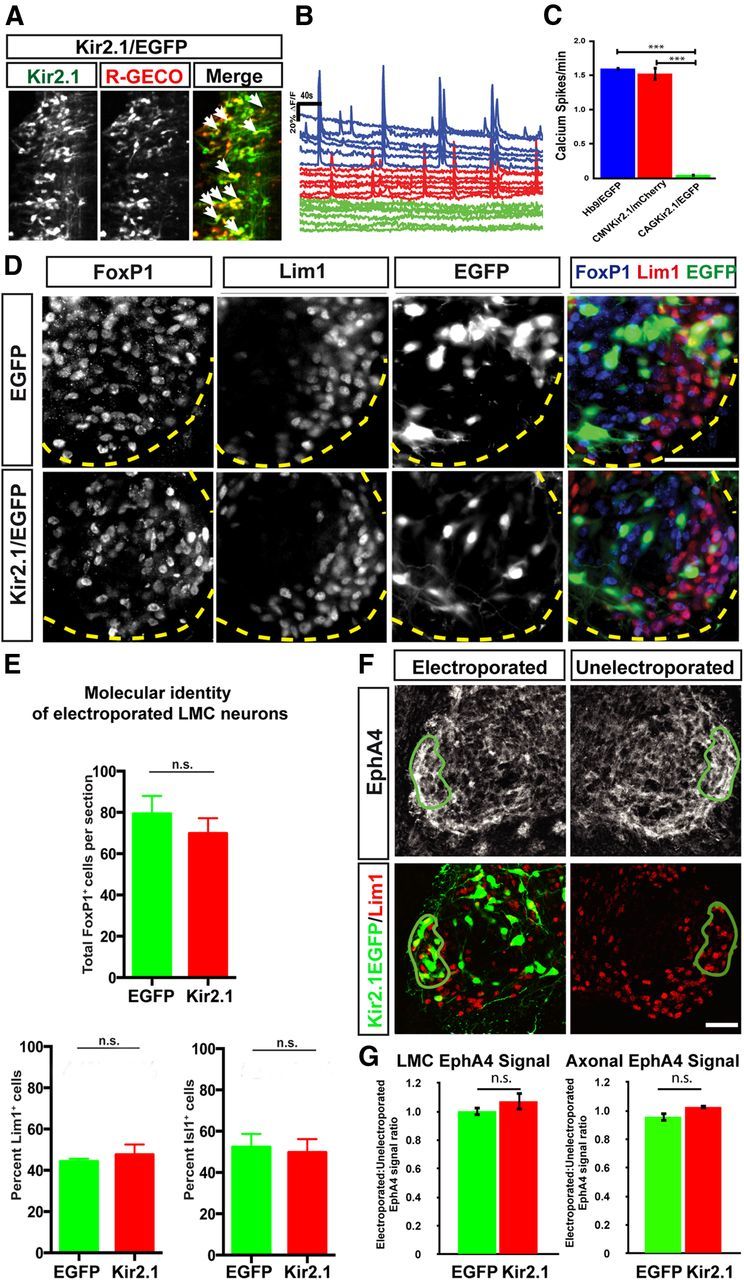
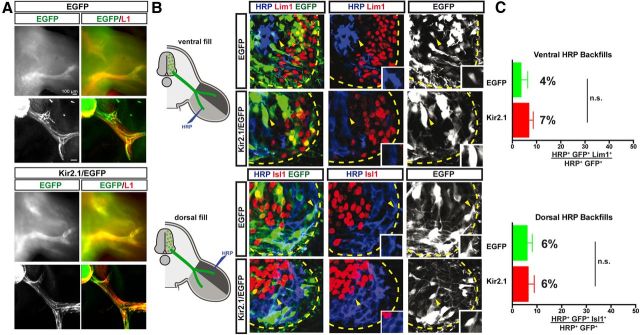
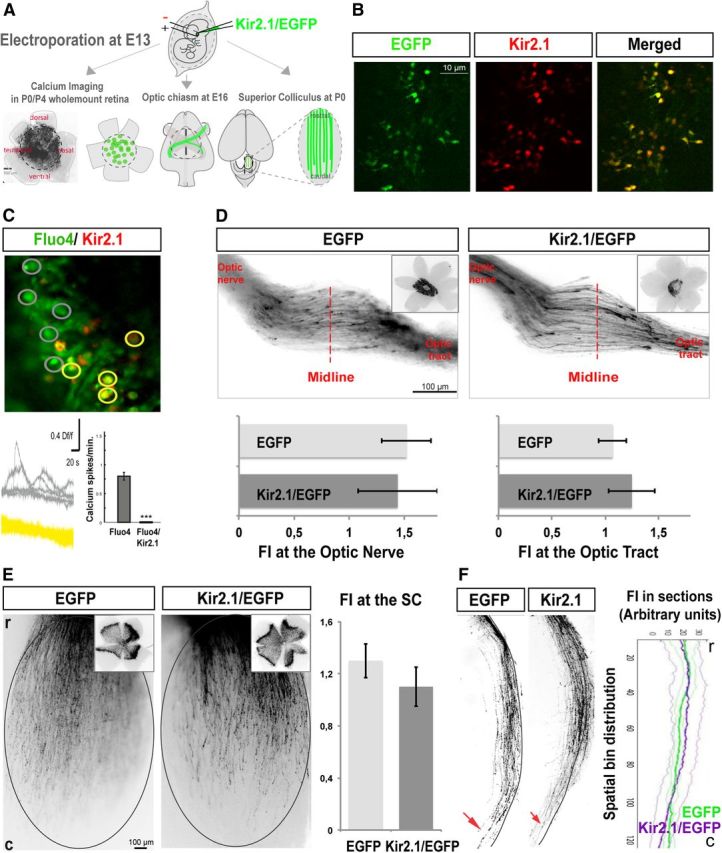
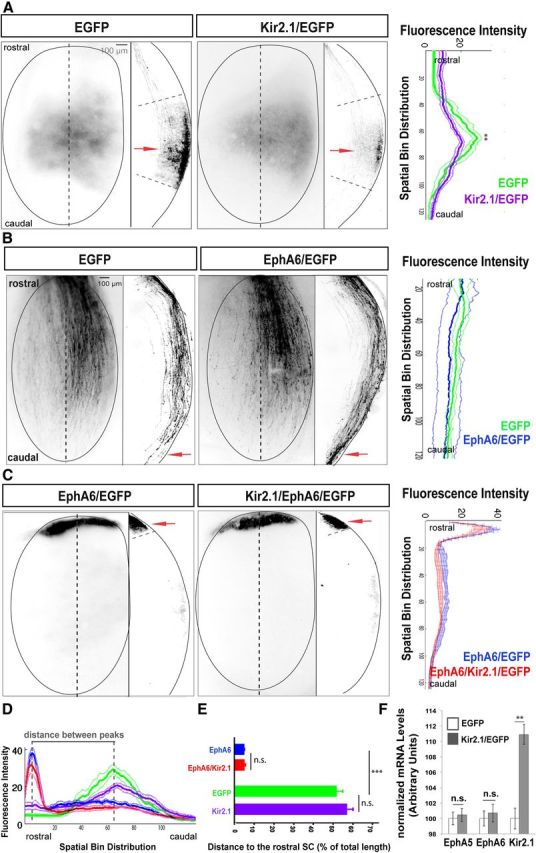
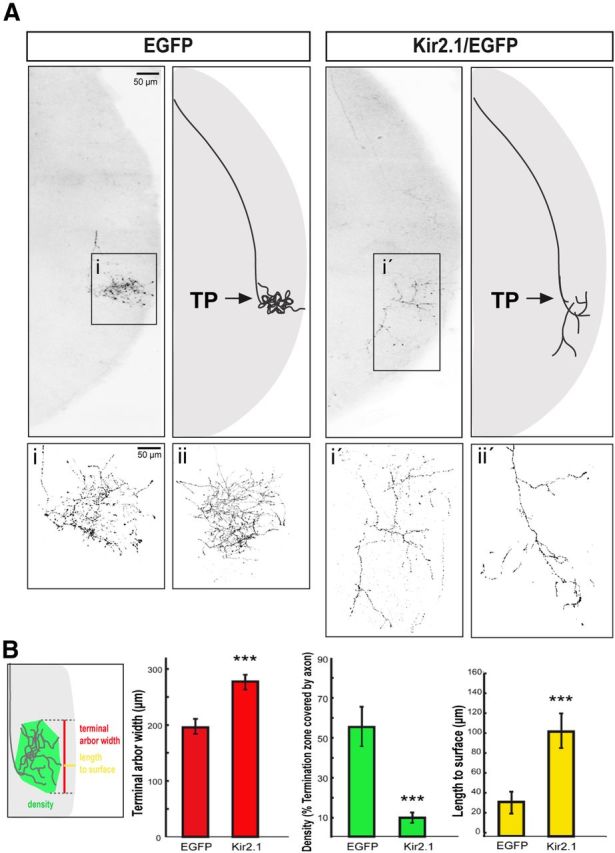
Classic studies have proposed that genetically encoded programs and spontaneous activity play complementary but independent roles in the development of neural circuits. Recent evidence, however, suggests that these two mechanisms could interact extensively, with spontaneous activity affecting the expression and function of guidance molecules at early developmental stages. Here, using the developing chick spinal cord and the mouse visual system to ectopically express the inwardly rectifying potassium channel Kir2.1 in individual embryonic neurons, we demonstrate that cell-intrinsic blockade of spontaneous activity in vivo does not affect neuronal identity specification, axon pathfinding, or EphA/ephrinA signaling during the development of topographic maps. However, intrinsic spontaneous activity is critical for axon branching and pruning once axonal growth cones reach their correct topographic position in the target tissues. Our experiments argue for the dissociation of spontaneous activity from hard-wired developmental programs in early phases of neural circuit formation.


Figures

Figure 1.
Figure 1.
Suppression of activity by Kir2.1 does not change the number, molecular identity, or EphA4 expression levels in motor neurons. A, Coelectroporation of Kir2.1/EGFP and R-GECO expression constructs leads to coexpression in multiple neurons (arrows). B, Neurons expressing either Hb9/EGFP (blue in the left panels) or Kir2.1/mCherry driven by the CMV promoter (red in the left panels) show robust activity in an ex vivo open-book preparation. In contrast, neurons expressing Kir2.1/EGFP driven by the CAG promoter are largely inactive (green in the right panels). C, Quantification of spontaneous activity shows a reduction in firing rate in neurons expressing Kir2.1/EGFP (firing rate, 0.05 ± 0.02 events/min) compared with neurons expressing either Hb9/EGFP (1.60 ± 0.006 events/min, p < 0.0001) or Kir2.1/mCherry (1.53 ± 0.09 events/min, p < 0.0001). Consistent results were observed in each of three embryos examined per condition (>30 neurons per condition). Values are expressed and plotted as the mean ± SEM. D, Detection of Foxp1, Lim1, and EGFP in the LMC region of EGFP- and Kir2.1/EGFP-electroporated embryos. Dotted yellow lines delineate the ventrolateral extent of the spinal gray matter. E, Motor neuron number was assessed by counting Foxp1+ nuclei in tissue sections of EGFP- or Kir2.1/EGFP-expressing embryos. We found, on average, 79 ± 8.8 Foxp1+ cells per section in embryos electroporated with EGFP and 70 ± 7.4 Foxp1+ cells per section in embryos electroporated with Kir2.1/EGFP (p > 0.05, Student's t test), demonstrating no change in total motor neuron number in embryos with inhibited activity (N = 5 for both EGFP- and Kir2.1/EGFP-treated embryos, n = 2085 and 2094 neurons, respectively). Molecular identity of motor neurons was assessed by quantification of Lim1+ and Isl1+ cells in EGFP- or Kir2.1/EGFP-electroporated embryos. In EGFP-electroporated embryos, 44 ± 1.3% of Foxp1+, EGFP+ cells expressed Lim1. In Kir2.1/EGFP-expressing embryos, 48 ± 5% of Foxp1+, EGFP+ cells expressed Lim1 (N = 5 for both EGFP+ and Kir2.1/EGFP+ embryos, n = 334 and 452 neurons, respectively). In EGFP-electroporated embryos, 52 ± 6.4% of Foxp1+, EGFP+ cells expressed Isl1. In Kir2.1/EGFP-expressing embryos, 50 ± 6.5% of Foxp1+, EGFP+ cells expressed Isl1 (N = 4 for EGFP+ and N = 5 for Kir2.1/EGFP+ embryos, n = 396 and 472 neurons respectively). Proportions of Lim1+ and Isl1+ motor neurons in Kir2.1/EGFP- and EGFP-expressing embryos were not significantly different (p > 0.05, Student's t test). Values are plotted as the mean ± SEM. F, Comparison between EphA4 expression in electroporated and unelectroporated sides of HH St. 29 spinal cords electroporated with Kir2.1/EGFP. A region encompassing all EGFP+ neurons in the Lim1+ LMC was selected on the electroporated side (green outline), then mean EphA4 intensity levels were measured in both that region and an equivalent region on the unelectroporated side. G, Quantification of EphA4 expression in the electroporated and unelectroporated sides of the LMC (left) and axons (right) of EGFP- and Kir2.1/EGFP-expressing embryos, expressed as a ratio. In the LMC, no difference is observed between EGFP- and Kir2.1/EGFP-expressing embryos (1.002:1 ± 0.06 vs 1.07:1 ± 0.03; p > 0.05, Student's t test). In axons, no difference is observed between EGFP- and Kir2.1/EGFP-expressing embryos (0.96:1 ± 0.11 vs 1.03:1 ± 0.01; p > 0.05, Student's t test); N = 4 embryos, n > 3 sections per embryo. Values are expressed and plotted as the mean ± SEM. Scale bars, 40 μm.
Figure 2.
Figure 2.
Suppression of activity by Kir2.1 expression does not affect the fidelity of LMC motor axon limb trajectories. A, Detection of L1 and GFP proteins in wholemounted limbs (top) or their sections (bottom) in chick HH st. 17/18 embryos electroporated with EGFP or Kir2.1/EGFP at HH st. 27/28. L1 protein (red) labels peripheral nerves, while green fluorescence labels only GFP+ axons. No differences in outgrowth timing or pattern were noted. B, Retrograde labeling of LMC neurons by HRP injections into ventral or dorsal hindlimb shank muscles of chick HH st. 29/30 embryos expressing EGFP or Kir2.1/EGFP. Images show detection of HRP (blue), Lim1 or Isl1 (red), and EGFP (green) in the LMC region of EGFP- or Kir2.1/EGFP-electroporated embryos injected with HRP into ventral (top) or dorsal (bottom) shank muscles. Insets in images show Lim1 or Isl1 MN electroporated with EGFP or Kir2.1/EGFP and backfilled, as expected, by ventral or dorsal fills (indicated with yellow arrowheads). C, Proportions (%) of electroporated and backfilled lateral or medial LMC MN in embryos injected with HRP into ventral or dorsal shank muscles. In ventrally filled EGFP-expressing embryos, 4 ± 3% of HRP+, EGFP+ LMC neurons were Lim1+. Similarly, in ventrally filled Kir2.1/EGFP-expressing embryos, 7 ± 2% of HRP+, EGFP+ LMC neurons were Lim1+ (N = 4 for both EGFP+ and Kir2.1/EGFP+ embryos, n = 187 and 221 neurons, respectively). In dorsally filled EGFP-expressing embryos, 6 ± 2% of HRP+, EGFP+ LMC neurons were Isl1+. Similarly, in dorsally filled Kir2.1/EGFP-expressing embryos, 6 ± 3% of HRP+, EGFP+ LMC neurons were Isl1+ (N = 3 for both EGFP+ and Kir2.1/EGFP+ embryos, n = 172 and 293 neurons, respectively). Proportions of HRP+, EGFP+ lateral or medial LMC neurons in ventrally or dorsally filled Kir2.1/EGFP-expressing embryos and those in ventrally or dorsally filled EGFP-expressing embryos are not significantly different (p > 0.05; Student's t test). Error bars indicate SEM. All values are expressed and plotted as the mean ± SEM. Scale bars, 40 μm.
Figure 3.
Figure 3.
Spontaneous activity is not required for RGC axon pathfinding or targeting to the SC. A, Schema summarizing the experimental procedures. The different plasmids were injected into the retina of E13 embryos by in utero electroporation. Only those retinas electroporated in equivalent central areas such as the electroporated retina shown in the image were considered for further analysis. Wholemount retinas of electroporated mice collected at postnatal stages were used for calcium imaging experiments. Axons from targeted RGCs were analyzed at the optic chiasm level in E16 embryos, and at P0 and P9 in the SC. B, Wholemount retinas from mice electroporated at E13 with Kir2.1/EGFP plasmids dissected at P9 and incubated with anti-Kir2.1 antibodies (red) demonstrate that Kir2.1 is coexpressed in targeted RGCs. C, Representative image of a calcium imaging experiment performed in retinas electroporated with Kir2.1/DsRed. Gray regions of interest represent cells loaded with Fluo4, and yellow regions of interest represent cells electroporated with Kir2.1/DsRed and loaded with Fluo4. Waveforms (middle) show overlaid examples of calcium activity taken from the regions of interest shown in the image. The histogram represents the absence of calcium transients in the Kir2.1/DsRed-electroporated RGCs and the normal pattern of spontaneous calcium activity in the Fluo4 control cells (gray bar). Thirty-three cells from five animals electroporated with EGFP, and 56 cells from five animals electroporated with Kir2.1/DsRed were used for quantification. ***p < 0.001 (Student's unpaired t test). Values are expressed as the mean ± SEM. D, RGC axons from embryos electroporated with Kir2.1/EGFP plasmids or EGFP alone show similar behavior at the optic chiasm level. Corresponding electroporated retinas are shown on the right. Graph at the left represents mean ± SEM fluorescence intensity at the optic nerve level normalized to the retinal fluorescence intensity (p = 0.42, Student's unpaired t test). Graph at the right represents the mean of fluorescence intensity at the contralateral optic tract level normalized to the retinal fluorescence intensity (p = 0.27, Student's unpaired t test). Error bars indicate SEM. All values are expressed and plotted as the mean ± SEM. Ten mice were used to measure fluorescence intensity in each condition. E, Representative examples of the SC (top view) of newborn mice that were electroporated at E13 with the indicated plasmids. Corresponding retinas are shown on the right corner. Graphs represent the mean fluorescence intensity in wholemount SCs normalized to fluorescence intensity in the retina (p = 0.44, Student's unpaired t test). Error bars indicate SEM. All values are expressed and plotted as the mean ± SEM. Eight mice were used to measure fluorescence intensity in each condition. r, Rostral; c, caudal. F, Representative sagittal sections through the medial SC. Red arrowheads indicate the termination of the majority of the targeted axons. Graphs represent the mean fluorescence intensity (FI) from three consecutive sections of the SCs of electroporated mice. Error bars indicate SEM. All values are expressed and plotted as the mean ± SEM. Five mice were used to measure fluorescence intensity in each condition. There are no significant differences between the behavior of axons electroporated with Kir2.1/EGFP or EGFP alone (one-way ANOVA).
Figure 4.
Figure 4.
Spontaneous activity is not necessary to transduce EphA/ephrinA signals during the establishment of the rostrocaudal visual map. A, Representative examples of the SC of P9 mice electroporated at E13 with the indicated plasmids. Top views of the SCs and sagittal sections through the SC at the level indicated by the dotted line are shown. Red arrows point to the most intense fluorescence area in each case. Graphs represent fluorescence intensity (mean ± SEM) from three consecutive sections of P9 electroporated mice (seven mice were used to measure fluorescence intensity in each condition). No significant differences between both graphs were observed in the distance of the TZ (peak of fluorescence) to the rostral SC (p = 0.02), although the termini distribution at the TZ of Kir2.1/EGFP-expressing mice was wider than that of controls (p = 0.0004). B, Representative example of P0 SCs electroporated at E13 with EphA6/EGFP or EGFP alone plasmids. Top views of the SC and sagittal sections through the SC at the level indicated by the dotted line are shown. Red arrows indicate the termination of the majority of targeted axons. Graphs represent the mean ± SEM fluorescence intensity from three consecutive sections of the SCs of electroporated mice (five mice were used to measure fluorescence intensity in each condition). The graphs show no significant differences in behavior among the axons electroporated with EphA6/EGFP or EGFP alone (one-way ANOVA). C, Representative examples of the SC of P9 mice electroporated at E13 with the indicated plasmids. Top views of the SCs and sagittal sections through the SC at the level indicated by the dotted line are shown. Red arrows point to the most intense fluorescence area in each case. Graphs represent fluorescence intensity (mean ± SEM) from three consecutive sections of P9 electroporated mice (seven mice were used to measure fluorescence intensity in each condition). No significant differences were observed between both graphs. D, Overlay demonstrates that fluorescence intensity peaks from samples expressing either EGFP or Kir2.1/EGFP and samples expressing either EphA6 or EphA6/Kir2.1 are very distant. E, Distance of RGC axons electroporated with the indicated plasmids to the most rostral point of the SC. Units are the percentage of the total collicular length once individual sections were conformed to a SC template. Values are plotted as the mean ± SEM. ***p < 0.001, Student's unpaired t test. n.s., Not significant. F, Graphs show mRNA levels for EphA5 and EphA6 in E16 retinas of embryos electroporated at E13 with EGFP alone or with Kir2.1/EGFP plasmids. Ten retinas/condition were pooled per experiment. The average of four experiments is shown. Values are plotted as the mean ± SEM. **p < 0.01, Student's unpaired t test.
Figure 5.
Figure 5.
Spontaneous activity is required for local axon remodeling at the terminal zone. A, Representative sagittal sections from the SC of P9 mice electroporated with EGFP alone or Kir2.1/EGFP. Axons show similar turning points (TP; arrows) along the rostrocaudal axis of the SC in both cases, as it corresponds to the central location of their cell bodies in the retina. Right panels are diagrams summarizing the result. Note that arborization is affected in the Kir2.1/EGFP axons compared with the controls electroporated with EGFP alone. i, i′, Close-up images of the squared areas. ii, ii′, More examples of terminal axons expressing EGFP or Kir2.1/EGFP. B, The scheme illustrates the three parameters used to measure axon terminals expressing EGFP or Kir2.1/EGFP: length to the surface, width, and density. The graphs show the average value of the three parameters (length, yellow bars; width, red bars; density, green bars) in Kir2.1/EGFP-expressing axons (n = 8) and in the controls expressing EGFP alone (n = 9). Values are plotted as the mean ± SEM. ***p < 0.001, Student's unpaired t test.

References

    1. Ackman JB, Burbridge TJ, Crair MC. Retinal waves coordinate patterned activity throughout the developing visual system. Nature. 2012;490:219–225. doi: 10.1038/nature11529. - DOI - PMC - PubMed
    1. Borodinsky LN, Spitzer NC. Activity-dependent neurotransmitter-receptor matching at the neuromuscular junction. Proc Natl Acad Sci U S A. 2007;104:335–340. doi: 10.1073/pnas.0607450104. - DOI - PMC - PubMed
    1. Burrone J, O'Byrne M, Murthy VN. Multiple forms of synaptic plasticity triggered by selective suppression of activity in individual neurons. Nature. 2002;420:414–418. doi: 10.1038/nature01242. - DOI - PubMed
    1. Cang J, Wang L, Stryker MP, Feldheim DA. Roles of ephrin-as and structured activity in the development of functional maps in the superior colliculus. J Neurosci. 2008;28:11015–11023. doi: 10.1523/JNEUROSCI.2478-08.2008. - DOI - PMC - PubMed
    1. Carreres MI, Escalante A, Murillo B, Chauvin G, Gaspar P, Vegar C, Herrera E. The transcription factor Foxd1 is required for the specification of the temporal retina. J Neurosci. 2011;31:5673–5681. doi: 10.1523/JNEUROSCI.0394-11.2011. - DOI - PMC - PubMed

Publication types

Substances

LinkOut - more resources