. 2014 Jan;88(2):1209-27.
doi: 10.1128/JVI.01987-13. Epub 2013 Nov 13.

Evolution and diversity in human herpes simplex virus genomes

Affiliations

Evolution and diversity in human herpes simplex virus genomes

Moriah L Szpara et al. J Virol. 2014 Jan.

Abstract

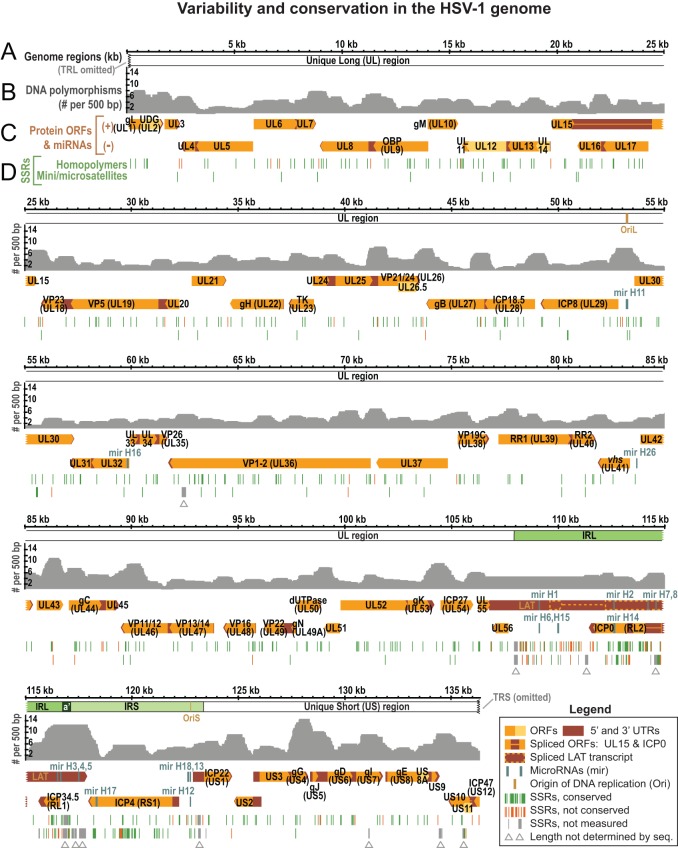
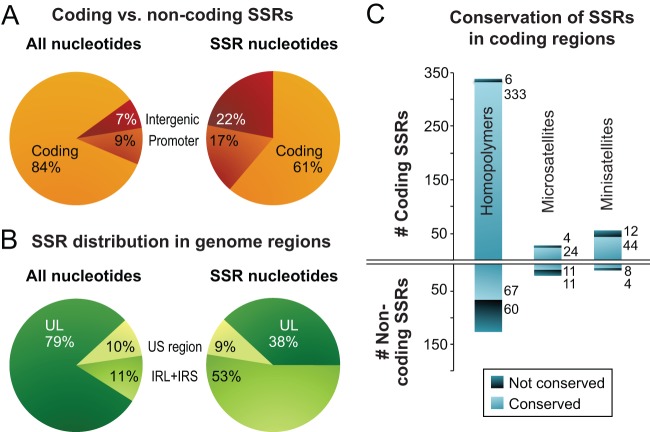
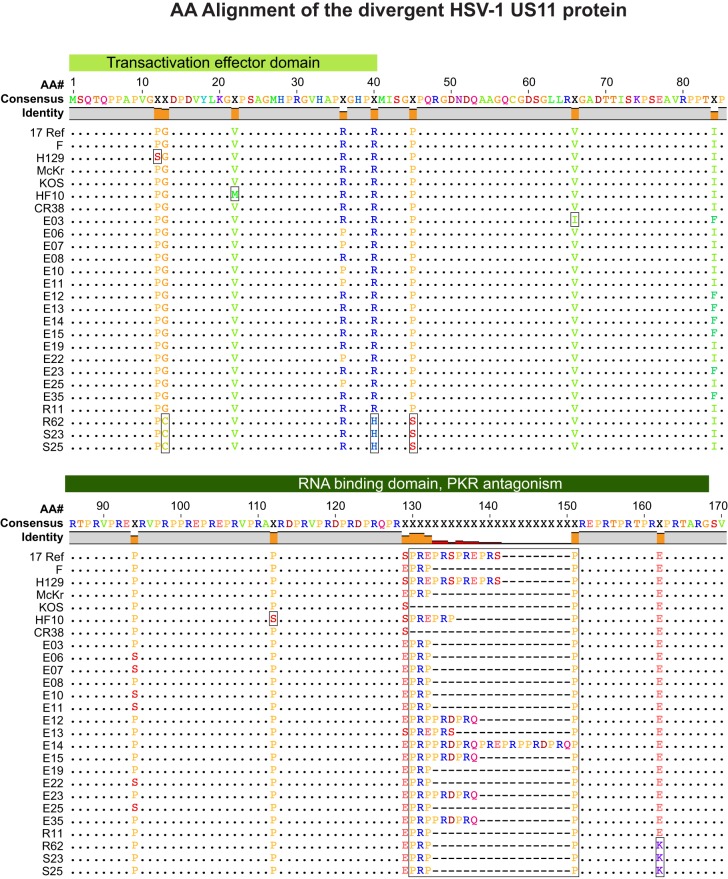
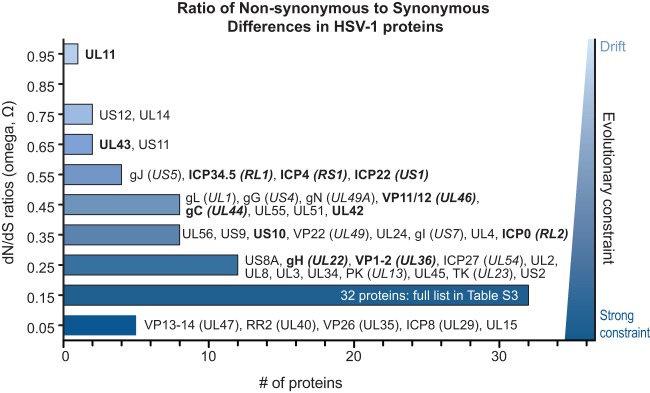
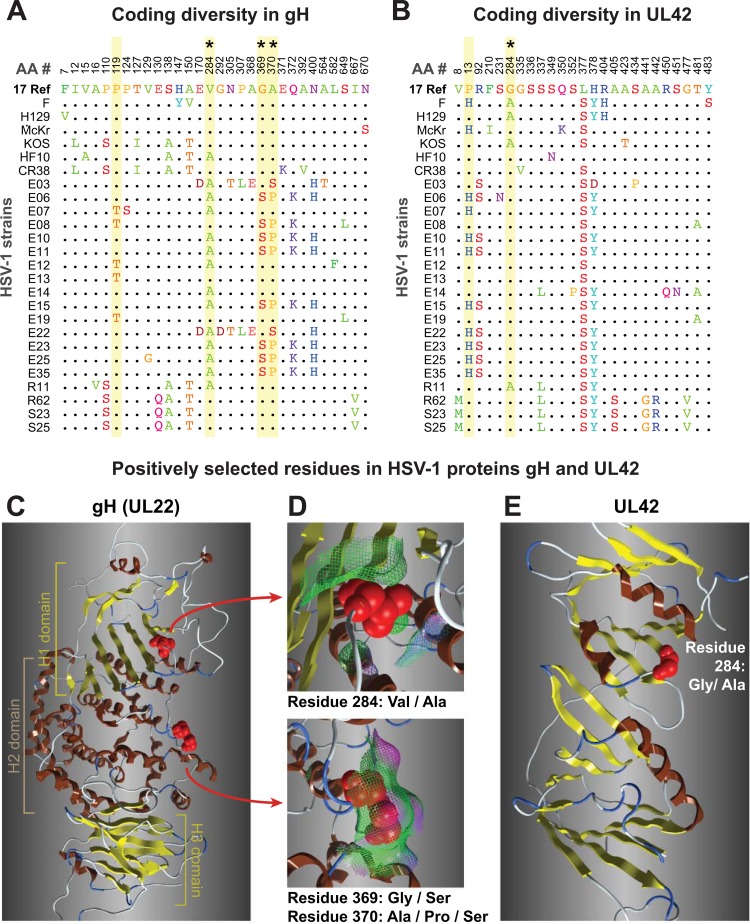
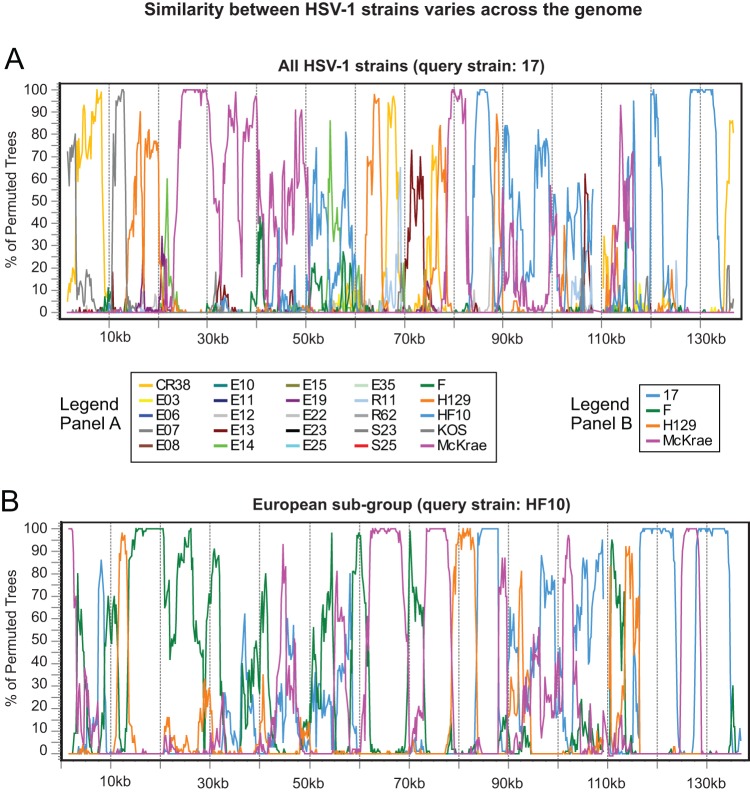
Herpes simplex virus 1 (HSV-1) causes a chronic, lifelong infection in >60% of adults. Multiple recent vaccine trials have failed, with viral diversity likely contributing to these failures. To understand HSV-1 diversity better, we comprehensively compared 20 newly sequenced viral genomes from China, Japan, Kenya, and South Korea with six previously sequenced genomes from the United States, Europe, and Japan. In this diverse collection of passaged strains, we found that one-fifth of the newly sequenced members share a gene deletion and one-third exhibit homopolymeric frameshift mutations (HFMs). Individual strains exhibit genotypic and potential phenotypic variation via HFMs, deletions, short sequence repeats, and single-nucleotide polymorphisms, although the protein sequence identity between strains exceeds 90% on average. In the first genome-scale analysis of positive selection in HSV-1, we found signs of selection in specific proteins and residues, including the fusion protein glycoprotein H. We also confirmed previous results suggesting that recombination has occurred with high frequency throughout the HSV-1 genome. Despite this, the HSV-1 strains analyzed clustered by geographic origin during whole-genome distance analysis. These data shed light on likely routes of HSV-1 adaptation to changing environments and will aid in the selection of vaccine antigens that are invariant worldwide.


Figures

FIG 1
FIG 1
The complete HSV-1 genome includes two unique regions and two sets of large inverted repeats. (A) The full structure of the HSV-1 genome includes a unique long region (UL) and a unique short region (US), each of which is flanked by inverted copies of large repeats known as the terminal and internal repeats of the long region (TRL and IRL) and the short region (TRS and IRS). The gene content of each region (UL, US, TRL/IRL, and TRS/IRS) is distinct, as shown in Fig. 3. The length of each region is marked; the regions are drawn approximately to scale. A short cleavage and packaging sequence called a is located as a direct repeat at both genome termini (in TRL and TRS) and as an inverted repeat (a') where IRS and IRL overlap. (B) Since sequences originating from one copy of an inverted repeat could not be distinguished from sequences originating from the other copy, the data were assembled into a trimmed form lacking the terminal repeats TRL and TRS. The GenBank records contain both a full-length and a trimmed version for each genome (see Materials and Methods for details).
FIG 2
FIG 2
Nucleotide compositional bias toward G+C residues in repeat regions of herpesvirus genomes. (A) A line graph overlay of G+C versus A+T distribution in the HSV-1 genome (JN555585; human herpesvirus 1 [HHV-1]). A diagram beneath the line graph depicts the locations of UL and US (gray), as well as TRL/IRL and TRS/IRS (orange). SSRs are also marked in orange. (B) Another human alphaherpesvirus, VZV, is A+T rich in the UL and US regions (56%) but G+C rich in the inverted repeat regions (59% G+C). (C to E) Similar plots depict nucleotide distribution in unique versus repeated regions of human beta- (human cytomegalovirus [HCMV]) and gammaherpesviruses (Epstein-Barr virus [EBV] and Kaposi's sarcoma-associated herpesvirus [KSHV]). Note that each genome is drawn to an individual scale, as marked below each line graph. The KSHV genome has 35 to 45 copies of a terminal repeat (TR) on its termini; we show 40 here. The genome diagram follows the NCBI Refseq annotation in displaying the EBV and KSHV TRs only on the right-hand side. These TRs join together in circularized genomes. Nucleotide sequences and annotations of unique and repeated regions are derived from NCBI RefSeq records as follows: VZV strain Dumas (accession number NC_001348), HCMV strain Merlin (NC_006273), EBV strain B95-8 (NC_007605), and KSHV strain GK18 (NC_009333).
FIG 3
FIG 3
Overview of the HSV-1 genome depicting coding regions, noncoding features, polymorphisms, and SSRs. (A) Locations of UL, US, IRL, and IRS in the genome of HSV-1 reference strain 17 (TRL and TRS are omitted). (B) Graph plotting the number of DNA polymorphisms per 500 bp (nongapped columns) in a whole-genome alignment of 26 HSV-1 sequences (from Table 1). (C) Well-known features of the HSV-1 reference genome are shown mapped to the two DNA strands. These include ORFs, the latency-associated transcript (LAT), untranslated regions (UTRs), origins of DNA replication (OriL and two copies of OriS), and microRNAs (miRNA or mir). Widely recognized protein names (e.g., gB, encoded by UL27) are included. (D) Locations of SSRs plotted along the reference genome, with homopolymers (the same nucleotide repeated ≥6 times in a row) plotted separately from larger microsatellites (repeating unit of 2 to 9 bp) and minisatellites (repeated unit of ≥10 bp). SSRs are color coded to distinguish those for which length is conserved in at least half of the 26 strains (green) versus those for which length is variable in a majority of strains (orange). Gray SSRs (marked by gray arrowheads) were not coded for conservation, since their length could not be determined by high-throughput sequencing in a majority of strains.
FIG 4
FIG 4
Localization and conservation of SSRs in HSV-1 strains. (A) SSRs in reference strain 17 are overrepresented in noncoding regions. The pie chart on the left shows the distribution of all nucleotides in the trimmed genome alignment among protein-coding and noncoding (promoter and intergenic) regions. The pie chart on the right shows the distribution of SSR-encoding nucleotides among protein-coding and noncoding regions. (B) SSRs in reference strain 17 are more common in the large repeat regions. The pie chart on the left shows the distribution of all nucleotide bases in the trimmed genome (Fig. 2B) among the unique long (UL), unique short (US), and internal repeat (IRL+IRS) regions. The pie chart on the right shows the distribution of SSR bases in UL, US, and IRL+IRS. (C) Although protein-coding SSRs outnumber noncoding repeats, they are more likely to be conserved in length. An SSR was counted as conserved if it had the same position and length (same number of repeated units) in a majority of strains. Coding SSRs are largely conserved in length (pale blue versus dark blue); the number of SSRs in each group is shown to the right of the histograms. In contrast, there are approximately equivalent numbers of conserved versus nonconserved SSRs in noncoding regions. SSRs with incomplete sequences in more than half the strains (gray in Fig. 3) were excluded.
FIG 5
FIG 5
Amino acid (AA) sequence conservation in the RNA-binding protein and PKR antagonist US11. The amino acid alignment of US11 shows it to be 89.5% identical across the 26 strains analyzed. Gray in the bar across the top indicates identical residues in all strains; orange indicates nonidentity. The median divergence of all strains versus the consensus (top line) is 1.2% (98.8% similarity to the consensus) (see Table 3; see also Table S3 in the supplemental material). Green-shaded blocks above the alignment indicate known functional regions of the protein (146–152). The variations in US11 illustrate those commonly seen among HSV-1 strains. Boxes indicate strain-specific SNPs (e.g., P12S, V22M, V66I, and P112S), variations shared by a group of strains (e.g., G13C, R40H, P45S, and E162K), and SSR-related indels (PRX repeat beginning at residue 130).
FIG 6
FIG 6
Distribution of Ω substitution rates for all HSV-1 proteins. Histogram of the number of HSV-1 proteins at each Ω substitution rate (in bins of 0.1, centered around the values shown). An Ω value of 1 indicates neutral selection or drift (light blue), whereas an Ω value of 0 indicates absolute constraint (dark blue). Protein names are listed next to each bin for all but the largest bin (0.1 to 0.19; see Table S3 in the supplemental material for list of all values). Protein names in boldface show signs of positive selection of individual amino acid residues (see Table 4). The average Ω value of 0.27 indicates that weak evolutionary constraint is the most common mode of protein evolution, while a few proteins approach levels indicating drift (UL11, US12, and UL14) and several others show strong selective constraint (UL15, VP26 [UL35], VP13-14 [UL47], RR2 [UL40], and ICP8 [UL29]). The Ω values reflect the overall amino acid sequence conservation values listed in Table 2.
FIG 7
FIG 7
Coding diversity and positive selection of residues in the HSV-1 entry protein gH and the DNA-binding protein UL42. (A and B) Amino acid sequence alignments of gH (UL22) (A) and UL42 (B) from 26 HSV-1 strains, showing only those positions where a residue varies in one or more strains compared to the residue in reference strain 17 (top line). Positions in the sequence are shown along the top. Yellow shading denotes residues exhibiting positive selection (Codeml, P > 99%; see Materials and Methods for details), and asterisks (*) mark those visible as red spheres on the 3-dimensional models in the panels below. (B) UL42 alignment from 26 HSV-1 strains, in which positive selection was detected for 829 residue 13 (P > 99%) and 284 (P > 95%). (C) Ribbon diagram of the HSV-1 gH ectodomain, homology modeled using the crystal structure of HSV-2 gH (77). Highlighted residues fall into the H1 and H2 domains described previously (77). (D) Surface interactions (surface indicated by mesh, color coded as follows: green, hydrophobic; pink, H bonding; blue, polar) are low for residue 284 (top) and are greater for the exposed pair of positively selected residues 369 and 370. (E) The available structure of UL42 (153) captures only residue 284, which lies adjacent to residues proposed to interact with DNA and with HSV-1 DNA polymerase (Pol [UL30]).
FIG 8
FIG 8
Dendrogram of genetic distances among HSV-1 genomes reveals broad geographic clustering. The multiple-genome alignment of 26 strains of HSV-1 was used to generate a genetic distance matrix under a maximum composite likelihood substitution model. A dendrogram was then calculated using UPGMA in MEGA, with 1,000 bootstrap replicates. Numbers indicate branch confidence. The majority of strains cluster into four groupings that reflect their geographic origins, with the large collection of African strains splitting into two groups or, potentially, three groups (i.e., E03 as a third singleton group).
FIG 9
FIG 9
Bootscan analyses of similarity between HSV-1 strains contain breakpoints suggesting frequent recombination. (A) Similarity plot of HSV-1 reference strain 17 versus all other strains, demonstrating that recombination occurs throughout the tree. The longest colinear area of similarity (between strains 17 and McKrae; rose line) is about 30 kb. The trimmed format of the HSV-1 strain 17 genome (Fig. 1B) was used as the query sequence. (B) Similarity plot of the European subgroup (as shown in Fig. 8) of the HSV-1 collection, with HF10 used as the query sequence. There is extensive recombination even within genetically similar geographical clusters. The longest colinear area of similarity (between HF10 and F; green line) is about 20 kb. Bootscan parameters were as follows: 3-kb window, 200-bp step size, GapStrip on, 100 repetitions, Kimura (2 parameter), T/t = 2.0, neighbor joining.

Comment in

References

    1. Davison AJ, Eberle R, Ehlers B, Hayward GS, McGeoch DJ, Minson AC, Pellett PE, Roizman B, Studdert MJ, Thiry E. 2009. The order Herpesvirales. Arch. Virol. 154:171–177. 10.1007/s00705-008-0278-4 - DOI - PMC - PubMed
    1. Whitley RJ, Roizman B. 2001. Herpes simplex virus infections. Lancet 357:1513–1518. 10.1016/S0140-6736(00)04638-9 - DOI - PubMed
    1. Taylor TJ, Brockman MA, McNamee EE, Knipe DM. 2002. Herpes simplex virus. Front. Biosci. 7:d752–d764. 10.2741/taylor - DOI - PubMed
    1. Roizman B, Sears E. 1996. Herpes simplex viruses and their replication, p 1043–1107 InIn Fields BN, Knipe DM, Howley PM. (ed), Fundamental virology, 3rd ed. Lippincott-Raven, Philadelphia, PA
    1. Johnston C, Koelle DM, Wald A. 2011. HSV-2: in pursuit of a vaccine. J. Clin. Invest. 121:4600–4609. 10.1172/JCI57148 - DOI - PMC - PubMed

Publication types