. 2014 Jan;25(2):245-56.
doi: 10.1091/mbc.E13-07-0404. Epub 2013 Nov 13.

ARP2/3-mediated junction-associated lamellipodia control VE-cadherin-based cell junction dynamics and maintain monolayer integrity

Affiliations

ARP2/3-mediated junction-associated lamellipodia control VE-cadherin-based cell junction dynamics and maintain monolayer integrity

Abdallah Abu Taha et al. Mol Biol Cell. 2014 Jan.

Abstract

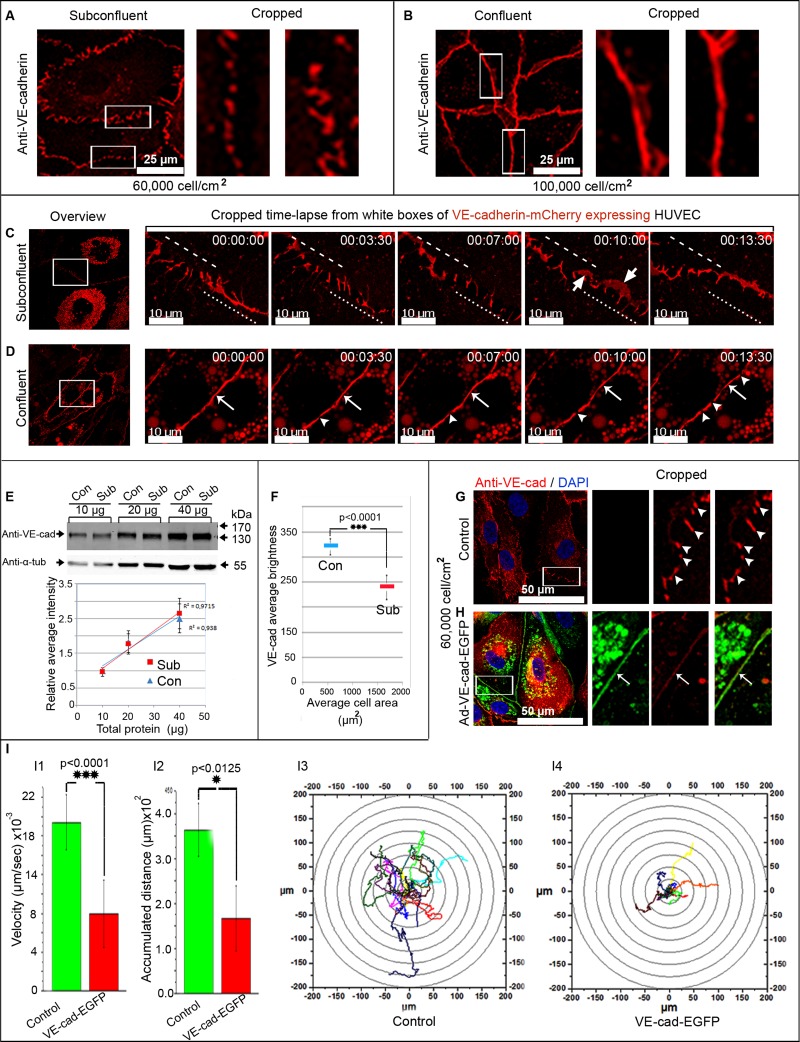
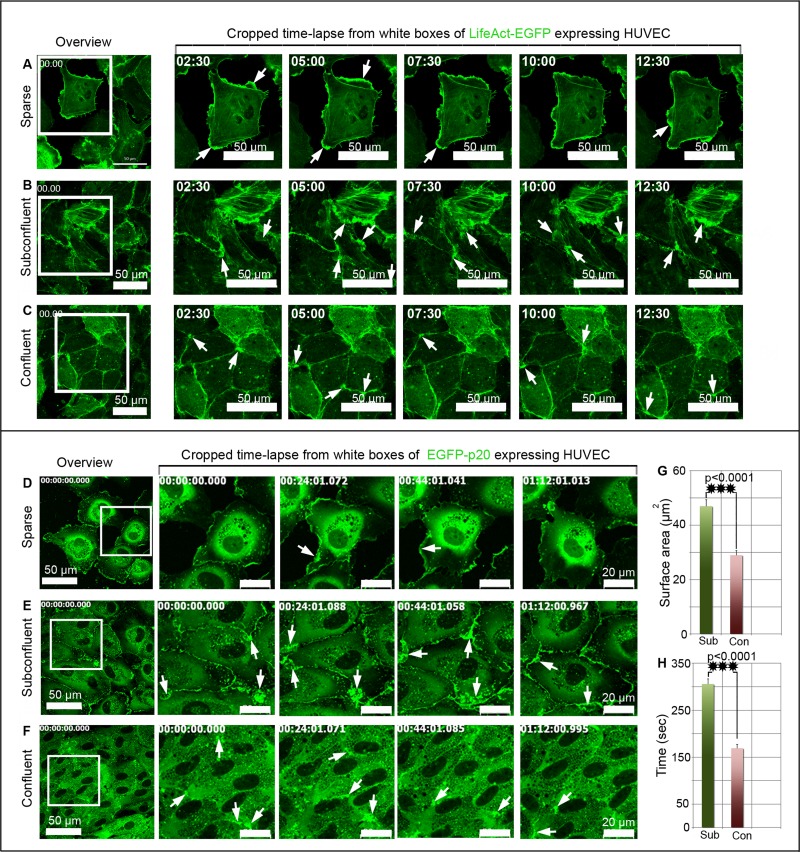
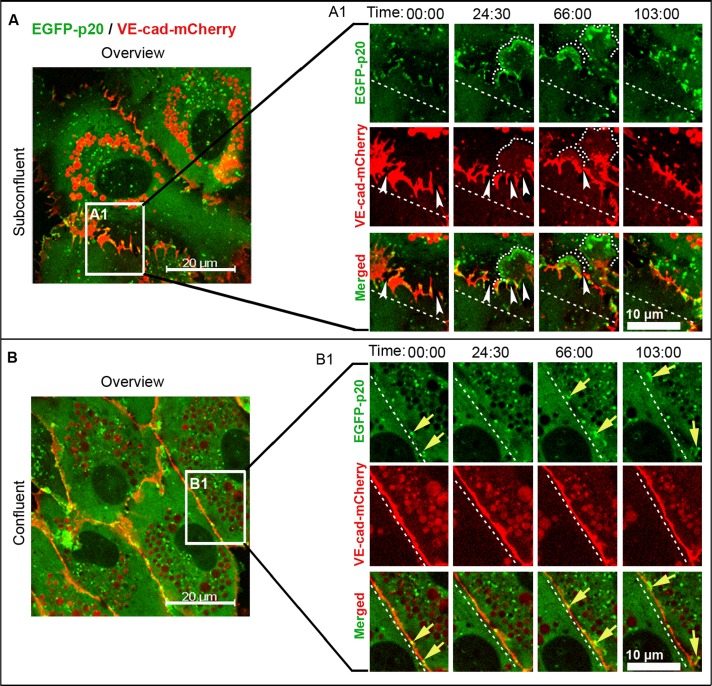
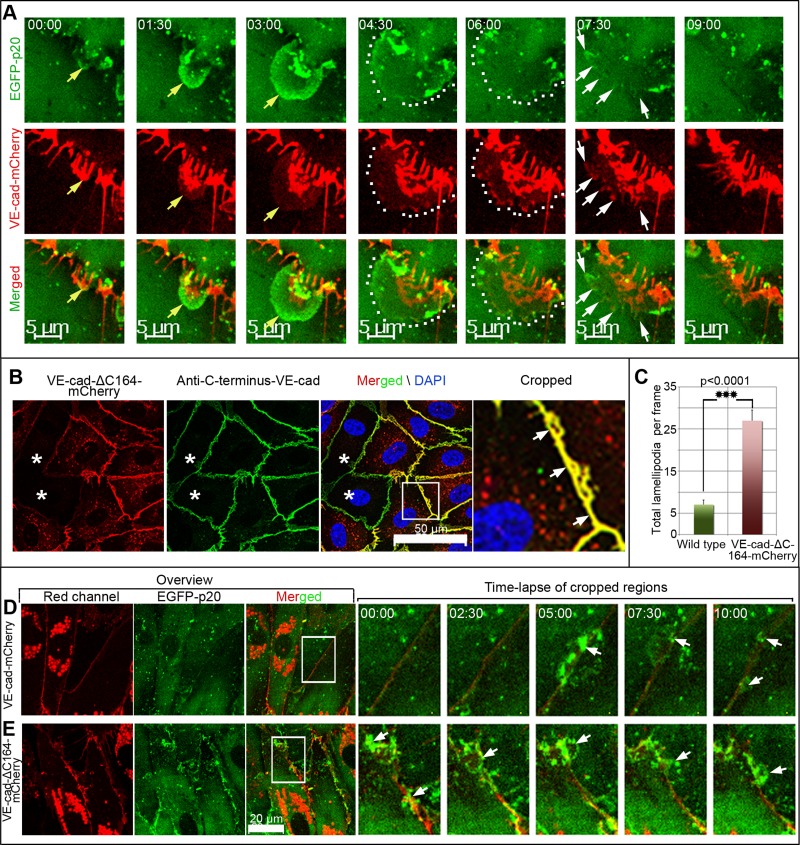
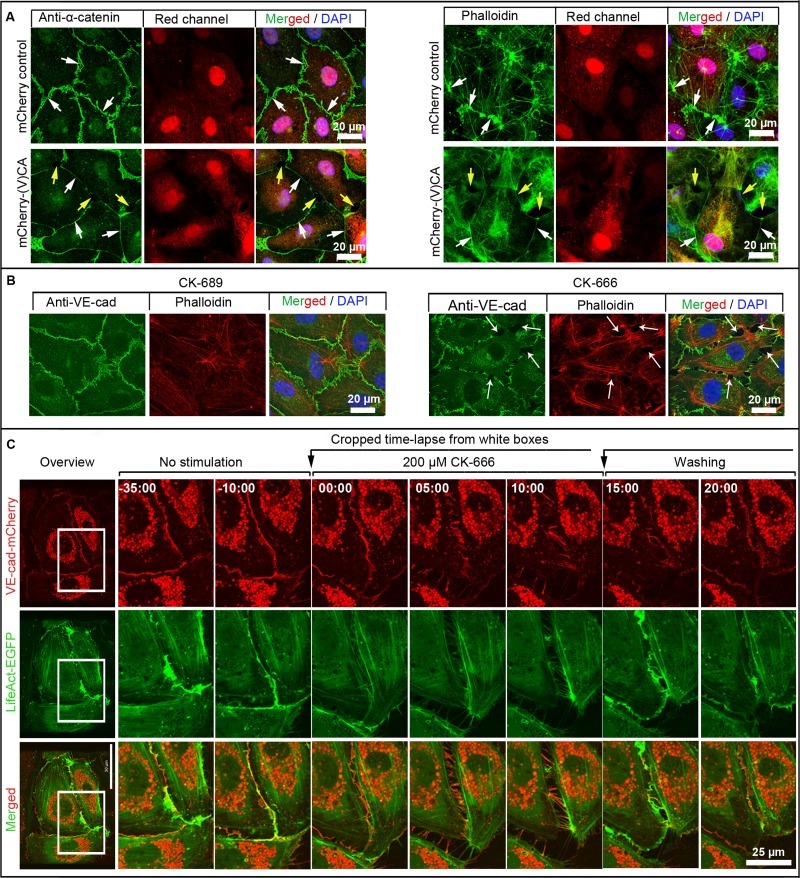
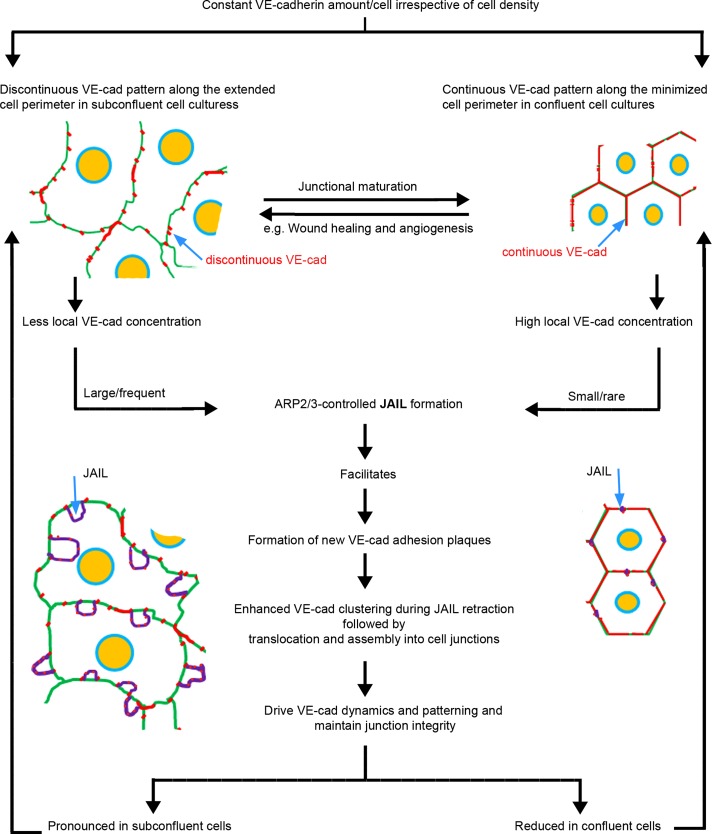
Maintenance and remodeling of endothelial cell junctions critically depend on the VE-cadherin/catenin complex and its interaction with the actin filament cytoskeleton. Here we demonstrate that local lack of vascular endothelial (VE)-cadherin at established cell junctions causes actin-driven and actin-related protein 2/3 complex (ARP2/3)-controlled lamellipodia to appear intermittently at those sites. Lamellipodia overlap the VE-cadherin-free adjacent plasma membranes and facilitate formation of new VE-cadherin adhesion sites, which quickly move into the junctions, driving VE-cadherin dynamics and remodeling. Inhibition of the ARP2/3 complex by expression of the N-WASP (V)CA domain or application of two ARP2/3 inhibitors, CK-548 and CK-666, blocks VE-cadherin dynamics and causes intercellular gaps. Furthermore, expression of carboxy-terminal-truncated VE-cadherin increases the number of ARP2/3-controlled lamellipodia, whereas overexpression of wild-type VE-cadherin largely blocks it and decreases cell motility. The data demonstrate a functional interrelationship between VE-cadherin-mediated cell adhesion and actin-driven, ARP2/3-controlled formation of new VE-cadherin adhesion sites via intermittently appearing lamellipodia at established cell junctions. This coordinated mechanism controls VE-cadherin dynamics and cell motility and maintains monolayer integrity, thus potentially being relevant in disease and angiogenesis.


Figures

FIGURE 1:
FIGURE 1:
VE-cadherin distribution and dynamics are cell-density dependent. (A, B) Native (A) subconfluent and (B) confluent HUVEC cultures were labeled with anti-VE-cadherin, which appears interrupted in subconfluent cultures, whereas confluent ones display a continuous line. (C, D) Time-lapse recordings of VE-cadherin-mCherry–expressing HUVEC. (C) Subconfluent cultures display a permanent change in VE-cadherin patterning. Overlapping VE-cadherin adhesion sites are marked (large arrows). (D) Confluent HUVEC mostly exhibit a continuous VE-cadherin distribution (small arrows) with very small interruptions (arrowheads; see also Supplemental Figure S1 and Supplemental Videos S1 and S2). Dynamic translocating junctions are indicated by dotted and dashed lines. (E–I) The relative junction-localized VE-cadherin concentration, but not the total amount of VE-cadherin, is cell-density dependent. (E) Western blot analyses of VE-cadherin taken from subconfluent and confluent HUVEC cultures. Different amounts of total cellular protein (10, 20, and 40 μg) were probed by anti–VE-cadherin, followed by densitometry and determination of r2. α-Tubulin served as an internal loading control. n = 3 independent dual-probe experiments (see also Supplemental Figure S2). (F) The relative junction-localized VE-cadherin concentration was determined by a quantification of the average brightness of cell junctions by a defined ROI plotted against average cell area (for details compare Supplemental Figure S2, C–E). Altogether 434 confluent cells and 75 subconfluent cells from three independent experiments were analyzed (p < 0.0001). (G–I) Overexpression of VE-cadherin-EGFP in subconfluent HUVEC cultures (∼6 × 10⁴ cells/cm2) down-regulates cell motility. (G, H) Immunolabeling of VE-cadherin in (G) native subconfluent HUVEC discloses the typical interrupted patterning, whereas (H) VE-cadherin-EGFP–overexpressing subconfluent HUVEC displayed a continuous line. (I) Quantification of the cell motility of native and VE-cadherin-EGFP–overexpressing cells is indicated by (I1) cell velocity, (I2) accumulated distance, and (I3, I4) track plots. Quantification was performed on 15 cells from 200 frames acquired within 5 h and 50 min (see also Supplemental Video S3).
FIGURE 2:
FIGURE 2:
Cell density–dependent actin and ARP2/3 complex dynamics at endothelial junctions. (A–C) LifeAct-EGFP and (D–F) EGFP-p20 were expressed in HUVEC cultures, and time-lapse recordings were performed at culture areas showing different cell densities within the same culture. (A–C) Left, overviews; white boxes indicate cropped and enlarged areas. (A) LifeAct-EGFP dynamics at lamellipodia (arrows) of single cells. (B) Large LifeAct-EGFP–positive and junction-associated lamellipodia (arrows) develop in subconfluent cells intermittently, whereas (C) only small ones (arrows) appear in confluent cultures (see also Supplemental Video S4). (D–F) Left, overviews; white boxes indicate cropped and enlarged areas. (D) EGFP-p20 dynamics is typically seen at lamellipodia (arrows) of single cells. (E) Large EGFP-p20–positive junction-associated lamellipodia (arrows) intermittently appear at junctions of subconfluent cells, whereas smaller ones are present in confluent cultures (see also Supplemental Video S6). (G, H) Quantification of lamellipodia size and duration in subconfluent (Sub) and confluent cultures (Con). Two hundred cells of both confluent and subconfluent culture were analyzed from n = 5 independent experiments. ***p < 0.0001. See also Supplemental Figure S2 and Supplemental Videos S4–S6.
FIGURE 3:
FIGURE 3:
ARP2/3-controlled JAIL develop at spaces between VE-cadherin clusters in a cell density–dependent manner. (A, B) Time-lapse recording (min:s) of EGFP-p20 (green) and VE-cadherin-mCherry (red) coexpressed in (A, A1) subconfluent and (B, B1) confluent HUVEC cultures. (A, B) Overviews; white boxes indicate cropped and magnified areas. (A1) Large, EGFP-p20 positive JAIL (dotted curved lines) of subconfluent cultures are prominent at interruption (white arrowheads) between VE-cadherin-mCherry clusters. (B1) Only small JAIL (yellow arrows) are visible at small VE-cadherin-mCherry interruptions in confluent HUVEC cultures. Dashed lines indicate reference lines in order to visualize translocating junctions. Frames are representative of 20 independent experiments with subconfluent cultures and 15 experiments using confluent cultures. See also Supplemental Figure S4 and Supplemental Video S7.
FIGURE 4:
FIGURE 4:
New VE-cadherin adhesion sites develop dynamically due to formation of JAIL, which are in turn controlled by the local VE-cadherin concentration. (A) Time-lapse series, taken from Supplemental Video S8, which shows a growing JAIL (top, yellow arrows), which induces new VE-cadherin-mCherry plaques (encircled by dotted lines) that cluster increasingly (white arrows) during JAIL retraction and assembly at cell junctions. See also Supplemental Figure S3 and Supplemental Video S8. (B) HUVEC cultures expressing VE-cad-ΔC164-mCherry (red) were labeled by an antibody specific to the carboxy-terminal domain of VE-cadherin (green), which demonstrated random incorporation of the mutant into the junctions (arrows in cropped and enlarged area). Stars indicate nontransduced cells. Nuclei are labeled by 4′,6-diamidino-2-phenylindole (blue). (C) Quantification of JAIL in subconfluent HUVEC cultures (6 × 10⁴ cells/cm2) expressing either VE-cadherin-mCherry and EGFP-p20 or VE-cad-ΔC164-mCherry and EGFP-p20, as indicated. (D, E) Time-lapse series of cropped areas (white boxes in the merged overview). As indicated, this demonstrates increased JAIL formation in VE-cad-ΔC164-mCherry–expressing HUVEC. Images depict one of three independent experiments. See also Supplemental Video S9.
FIGURE 5:
FIGURE 5:
ARP2/3-controlled JAIL maintaining endothelial monolayer integrity. (A) HUVEC expressing either mCherry for control (red, top) or the mCherry-(V)CA domain (red, bottom), which was labeled with anti–α-catenin or phalloidin–Alexa Fluor 488, as indicated. Control HUVEC cultures exhibit the characteristic α-catenin patterning with small JAIL (white arrows, top). Expression of the mCherry-(V)CA domain causes small and faint continuous α-catenin and actin labeling (white arrows, bottom) accompanied by gap formation (yellow arrows, bottom). Nuclei are labeled by 4′,6-diamidino-2-phenylindole (blue). See also Supplemental Video S10. (B) ARP2/3 complex inhibitor CK-666 causes intercellular gap formation. Native HUVEC were treated with either inactive inhibitor, CK-689, for control, or active inhibitor, CK-666, for ∼15 min. This was followed by immunolabeling of VE-cadherin (green) and actin filaments with phalloidin–tetramethylrhodamine isothiocyanate (red). CK-666–treated cultures exhibit interendothelial gaps (arrows) accompanied by VE-cadherin and actin recruitment to cell junctions. Shown is one of three independent experiments that yielded similar results. (C) Overview (left) of HUVEC expressing both VE-cad-mCherry and EGFP-p20. Time-lapse series (right) of ARP2/3 inhibitor CK-666 treatment followed by washout, as indicated. The inhibitor caused intercellular gaps accompanied by VE-cadherin remodeling as it recovers after the washing out. Shown is one of three independent experiments that yielded similar results.
FIGURE 6:
FIGURE 6:
Scheme illustrating the interdependence between JAIL activity and VE-cadherin dynamics.

Similar articles

Cited by

References

    1. Adamson RH, et al. Rho and Rho kinase modulation of barrier properties: cultured endothelial cells and intact microvessels of rats and mice. J Physiol. 2002;539:295–308. - PMC - PubMed
    1. Baum B, Georgiou M. Dynamics of adherens junctions in epithelial establishment, maintenance, and remodeling. J Cell Biol. 2011;192:907–917. - PMC - PubMed
    1. Beckers CM, van Hinsbergh VW, van Nieuw Amerongen GP. Driving Rho GTPase activity in endothelial cells regulates barrier integrity. Thromb Haemost. 2010;103:40–55. - PubMed
    1. Brieher WM, Yap AS. Cadherin junctions and their cytoskeleton(s) Curr Opin Cell Biol. 2013;25:39–46. - PubMed
    1. Carramusa L, Ballestrem C, Zilberman Y, Bershadsky AD. Mammalian diaphanous-related formin Dia1 controls the organization of E-cadherin-mediated cell-cell junctions. J Cell Sci. 2007;120:3870–3882. - PubMed

Publication types

MeSH terms

LinkOut - more resources