. 2013:2013:475427.
doi: 10.1155/2013/475427. Epub 2013 Oct 21.

A neural network model can explain ventriloquism aftereffect and its generalization across sound frequencies

Affiliations

A neural network model can explain ventriloquism aftereffect and its generalization across sound frequencies

Elisa Magosso et al. Biomed Res Int. 2013.

Abstract

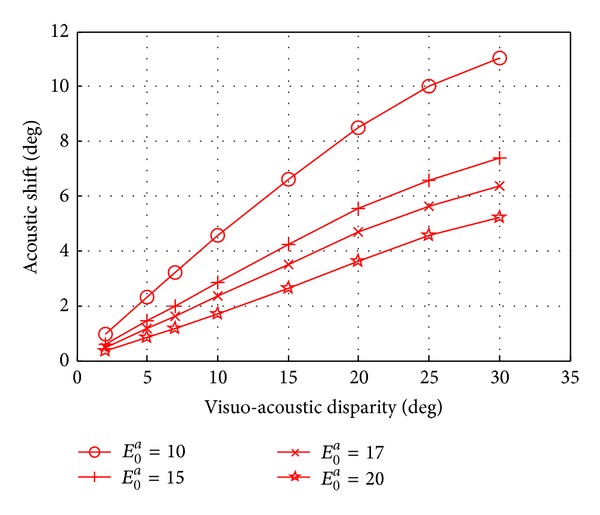
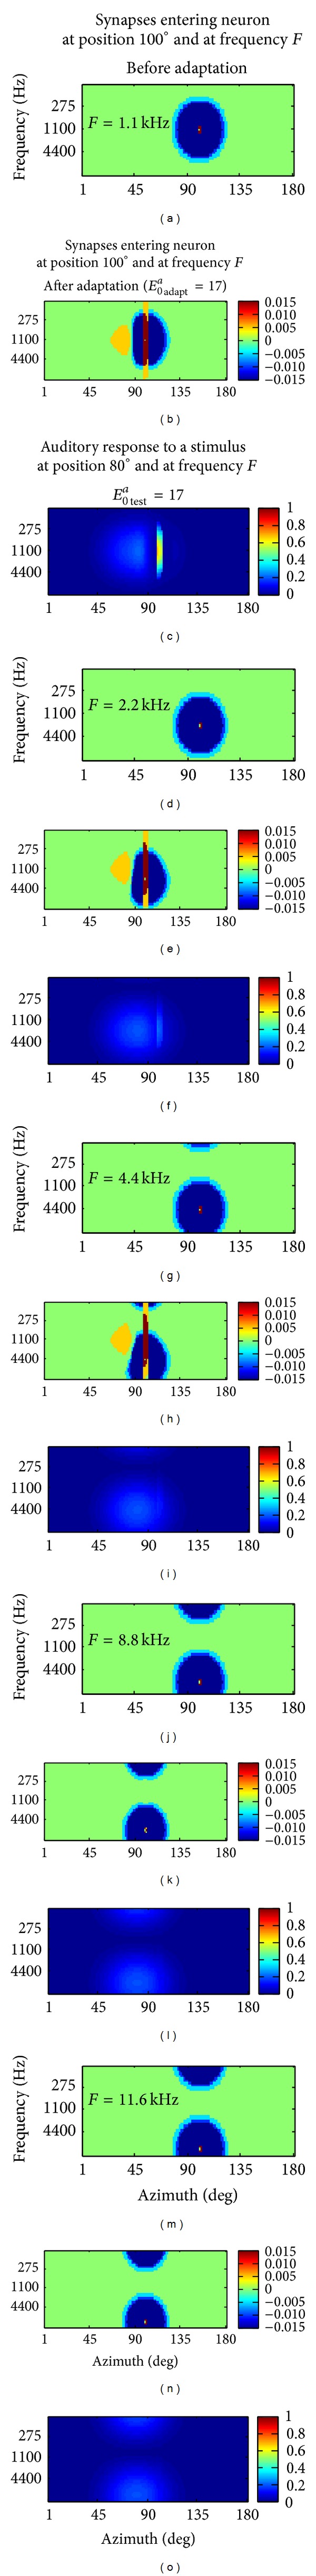
Exposure to synchronous but spatially disparate auditory and visual stimuli produces a perceptual shift of sound location towards the visual stimulus (ventriloquism effect). After adaptation to a ventriloquism situation, enduring sound shift is observed in the absence of the visual stimulus (ventriloquism aftereffect). Experimental studies report opposing results as to aftereffect generalization across sound frequencies varying from aftereffect being confined to the frequency used during adaptation to aftereffect generalizing across some octaves. Here, we present an extension of a model of visual-auditory interaction we previously developed. The new model is able to simulate the ventriloquism effect and, via Hebbian learning rules, the ventriloquism aftereffect and can be used to investigate aftereffect generalization across frequencies. The model includes auditory neurons coding both for the spatial and spectral features of the auditory stimuli and mimicking properties of biological auditory neurons. The model suggests that different extent of aftereffect generalization across frequencies can be obtained by changing the intensity of the auditory stimulus that induces different amounts of activation in the auditory layer. The model provides a coherent theoretical framework to explain the apparently contradictory results found in the literature. Model mechanisms and hypotheses are discussed in relation to neurophysiological and psychophysical data.


Figures

Figure 1
Figure 1
Network architecture. The two central rectangles represent the visual (array) and auditory (matrix) neurons. The other panels represent the basal connections that depart from the neurons marked with the two black bullets: the lateral panels represent interlayer connections, while the top and bottom panels represent intralayer connections. The colormaps are normalized to their maximum value and centered in 0.
Figure 2
Figure 2
Network response to unimodal stimuli. Left panels ((a) and (c)) show the response of the visual and auditory layers to a visual stimulus at 100° with E 0 v = 15. Right panels ((b) and (d)) show the response of the visual and auditory layers to an auditory stimulus at 80° and 1.1 kHz with E 0 a = 20. The two insets in (d) display the response profiles along the azimuth at frequency 1.1 kHz (bottom inset) and along the frequency at azimuth 80° (right inset).
Figure 3
Figure 3
Sensitivity analysis on the tuning functions of auditory neurons. (a) shows the azimuthal tuning function of a generic auditory neuron for different intensities of the auditory stimulus. (b) shows the frequency tuning function of a generic auditory neuron for different intensities of the auditory stimulus (along the y axis); the map is normalized with respect to the peak activation.
Figure 4
Figure 4
Activation of auditory neurons in response to an auditory stimulus applied at 80° and 1.1 kHz with intensity E 0 a = 17 (a) and E 0 a = 20 (b).
Figure 5
Figure 5
Activation of auditory neurons at different simulation steps (t = 1, 2, 4, 7, 12, and 25 ms) during the presentation of a visual stimulus at 100° and an auditory stimulus at 80° and 1.1 kHz (E 0 a = 20).
Figure 6
Figure 6
Activation of auditory neurons (at steady state) in response to spatially disparate visual auditory stimulation (the same stimuli position as in Figure 5) using auditory stimulus intensity E 0 a = 17 (a) and E 0 a = 20 (b).
Figure 7
Figure 7
Ventriloquism effect simulated using different sound intensities and displayed as a function of the spatial disparities between the visual and the auditory stimuli.
Figure 8
Figure 8
Effects of network training with E 0 a adapt = 20 and of network testing (after adaptation) with E 0 a test = 20. The adaptation position was 80°, and the adaptation frequency was 1.1 kHz. The first column shows the untrained synapses that target neuron at azimuth 100° and frequency F; the second column shows the same synapses after the adaptation; the third column shows the response to the test stimulus applied at azimuth 80° and frequency F. The value for the frequency F depends on the row of panels, as indicated inside the left panel in each row.
Figure 9
Figure 9
Effects of network training with E 0 a adapt = 17 and of network testing (after adaptation) with E 0 a test = 17. The adaptation position was 80° and the adaptation frequency was 1.1 kHz. The panels show the same quantities as respective panels in Figure 8.
Figure 10
Figure 10
Aftereffect generalization. The plot shows the influence of the auditory stimulus intensity on the aftereffect generalization across frequencies (one octave per grid line), when the adaptation intensity is equal to the test intensity (E 0 a adapt = E 0 a test).
Figure 11
Figure 11
Aftereffect generalization when using different values of intensity for the adaption stimulus (E 0 a adapt) and for the test stimulus (E 0 a test). In the left panels, E 0 a adapt was kept fixed (E 0 a adapt= 17 in (a) and E 0 a adapt = 20 in (c)), while E 0 a test ranged from 17 to 23 (the meaning of the line color is indicated in the legend). In the right panels, E 0 a test was kept constant (E 0 a test = 17 in (b) and E 0 a test = 20 in (d)) to test the network trained with E 0 a adapt ranging from 17 to 23 (the meaning of the line color is indicated in the legend).

References

    1. Alais D, Newell FN, Mamassian P. Multisensory processing in review: from physiology to behaviour. Seeing and Perceiving. 2010;23(1):3–38. - PubMed
    1. Ernst MO, Bülthoff HH. Merging the senses into a robust percept. Trends in Cognitive Sciences. 2004;8(4):162–169. - PubMed
    1. Stein BE, Meredith MA. The Merging of Senses. The MIT Press; 1993.
    1. Welch RB, Warren DH. Immediate perceptual response to intersensory discrepancy. Psychological Bulletin. 1980;88(3):638–667. - PubMed
    1. Bertelson P, Radeau M. Cross-modal bias and perceptual fusion with auditory-visual spatial discordance. Perception and Psychophysics. 1981;29(6):578–584. - PubMed

LinkOut - more resources