

The UKCAT-12 study: educational attainment, aptitude test performance, demographic and socio-economic contextual factors as predictors of first year outcome in a cross-sectional collaborative study of 12 UK medical schools
- PMID: 24229380
- PMCID: PMC3827332
- DOI: 10.1186/1741-7015-11-244
The UKCAT-12 study: educational attainment, aptitude test performance, demographic and socio-economic contextual factors as predictors of first year outcome in a cross-sectional collaborative study of 12 UK medical schools
Abstract
Background: Most UK medical schools use aptitude tests during student selection, but large-scale studies of predictive validity are rare. This study assesses the United Kingdom Clinical Aptitude Test (UKCAT), and its four sub-scales, along with measures of educational attainment, individual and contextual socio-economic background factors, as predictors of performance in the first year of medical school training.
Methods: A prospective study of 4,811 students in 12 UK medical schools taking the UKCAT from 2006 to 2008 as a part of the medical school application, for whom first year medical school examination results were available in 2008 to 2010.
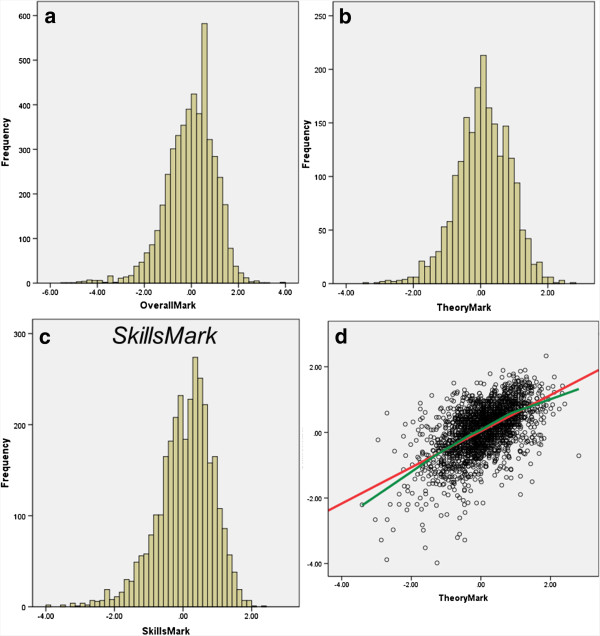
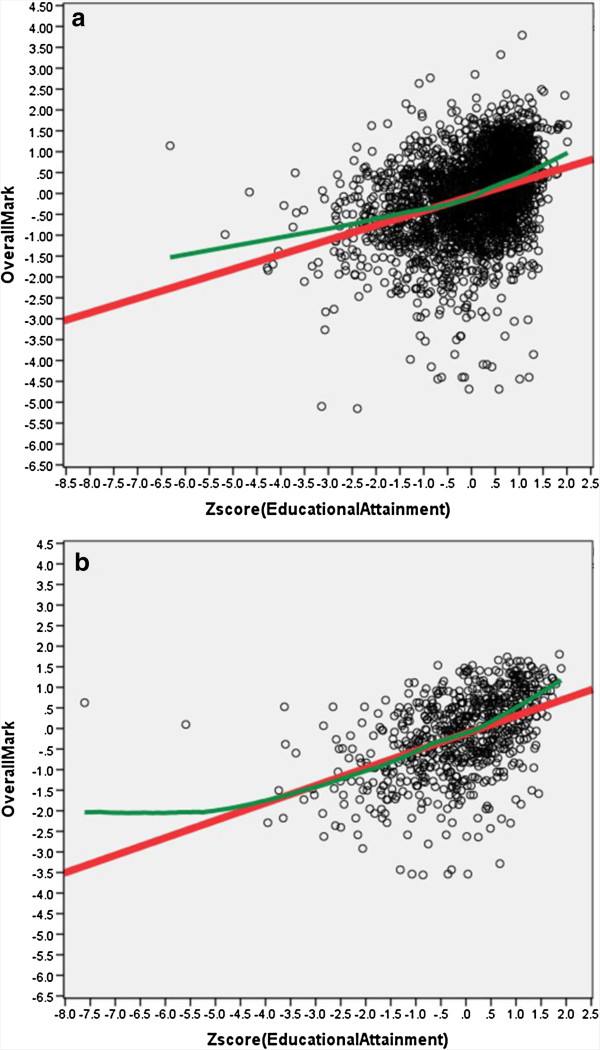
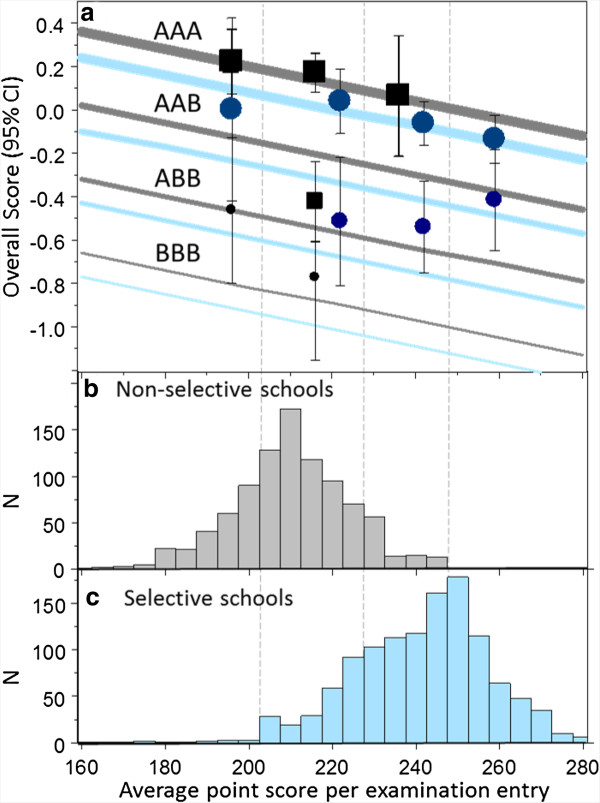
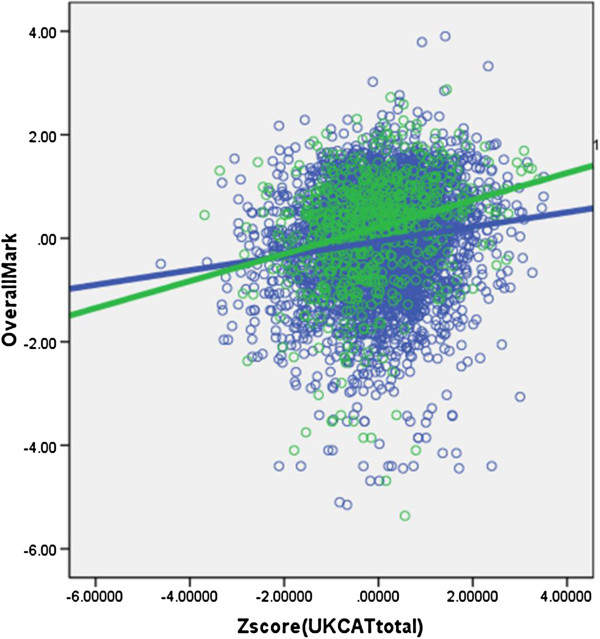
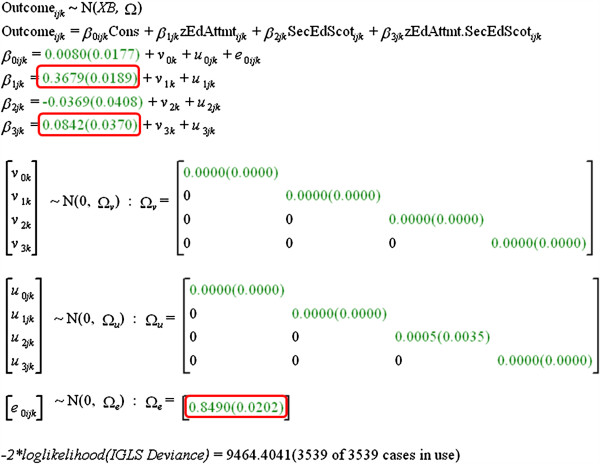
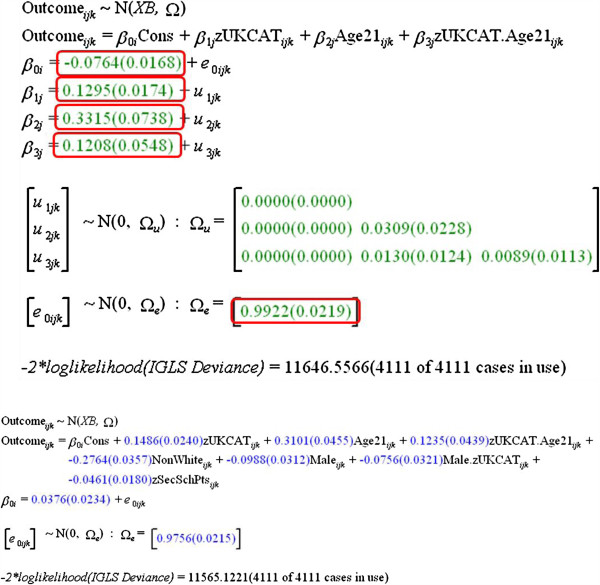
Results: UKCAT scores and educational attainment measures (General Certificate of Education (GCE): A-levels, and so on; or Scottish Qualifications Authority (SQA): Scottish Highers, and so on) were significant predictors of outcome. UKCAT predicted outcome better in female students than male students, and better in mature than non-mature students. Incremental validity of UKCAT taking educational attainment into account was significant, but small. Medical school performance was also affected by sex (male students performing less well), ethnicity (non-White students performing less well), and a contextual measure of secondary schooling, students from secondary schools with greater average attainment at A-level (irrespective of public or private sector) performing less well. Multilevel modeling showed no differences between medical schools in predictive ability of the various measures. UKCAT sub-scales predicted similarly, except that Verbal Reasoning correlated positively with performance on Theory examinations, but negatively with Skills assessments.
Conclusions: This collaborative study in 12 medical schools shows the power of large-scale studies of medical education for answering previously unanswerable but important questions about medical student selection, education and training. UKCAT has predictive validity as a predictor of medical school outcome, particularly in mature applicants to medical school. UKCAT offers small but significant incremental validity which is operationally valuable where medical schools are making selection decisions based on incomplete measures of educational attainment. The study confirms the validity of using all the existing measures of educational attainment in full at the time of selection decision-making. Contextual measures provide little additional predictive value, except that students from high attaining secondary schools perform less well, an effect previously shown for UK universities in general.
Figures
Comment in
-
Selecting the right medical student.BMC Med. 2013 Nov 14;11:245. doi: 10.1186/1741-7015-11-245. BMC Med. 2013. PMID: 24229397 Free PMC article.
References
-
- Bekhradnia B, Thompson J. Who Does Best at University? London: Higher Education Funding Council England; 2002. http://webarchive.nationalarchives.gov.uk/20081202000732/http://hefce.ac...
-
- Trapmann S, Hell B, Weigand S, Schuler H. Die Validität von Schulnoten zur Vorhersage des Studienerfolgs – eine Metaanalyse. Z Pädagog Psychol. 2007;21:11–27.
Publication types
MeSH terms
LinkOut - more resources
Full Text Sources
Other Literature Sources
