. 2013 Nov 11;24(5):631-44.
doi: 10.1016/j.ccr.2013.10.009.

CXCR2-expressing myeloid-derived suppressor cells are essential to promote colitis-associated tumorigenesis

Affiliations

CXCR2-expressing myeloid-derived suppressor cells are essential to promote colitis-associated tumorigenesis

Hiroshi Katoh et al. Cancer Cell. .

Abstract

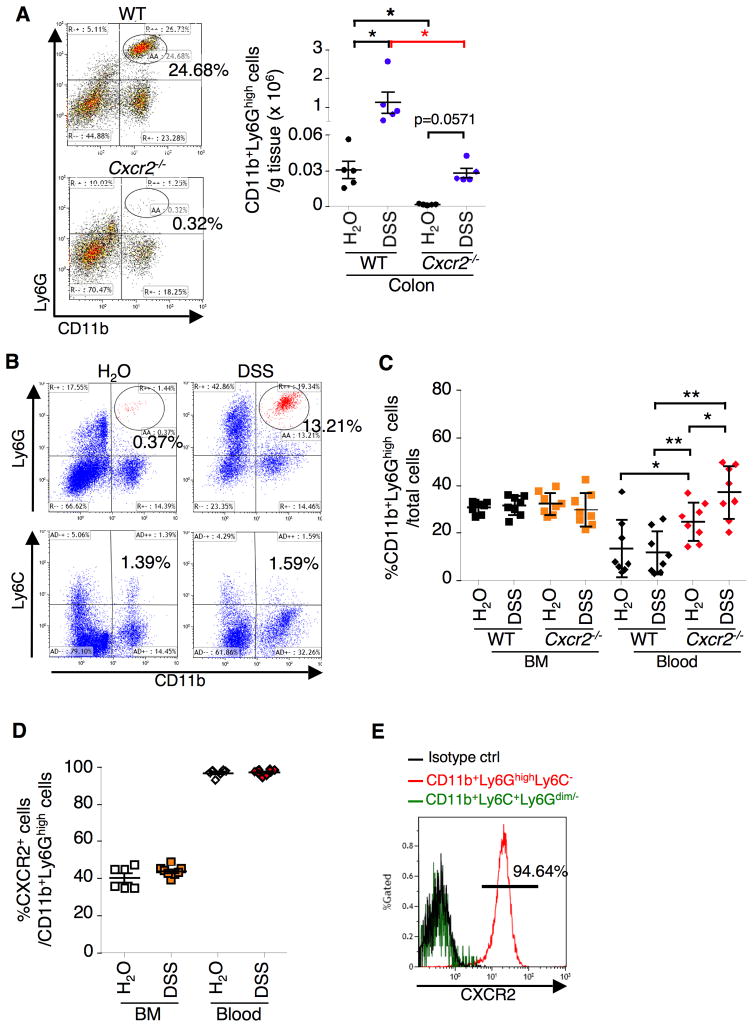
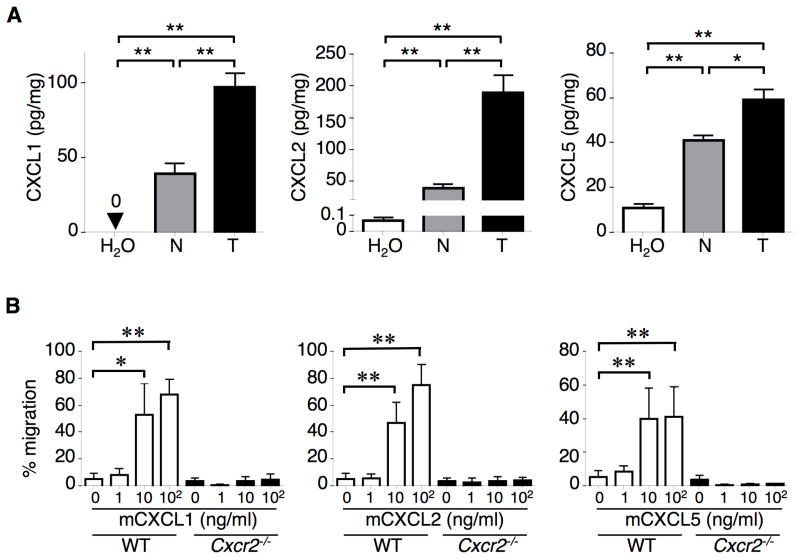
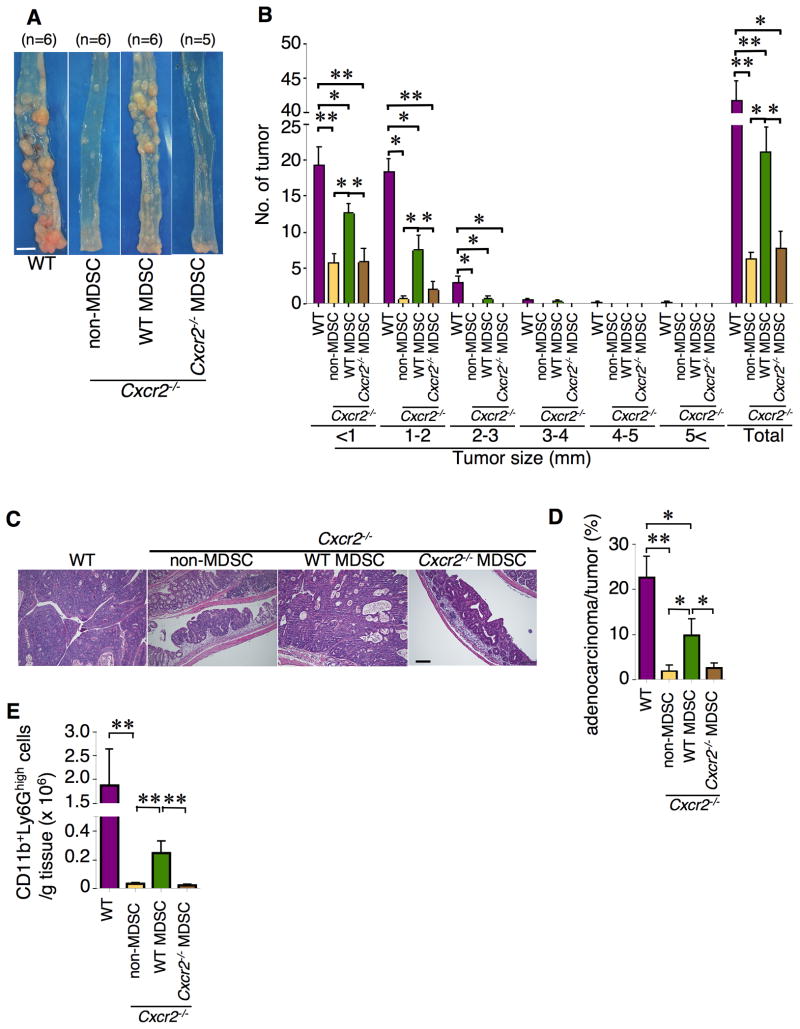
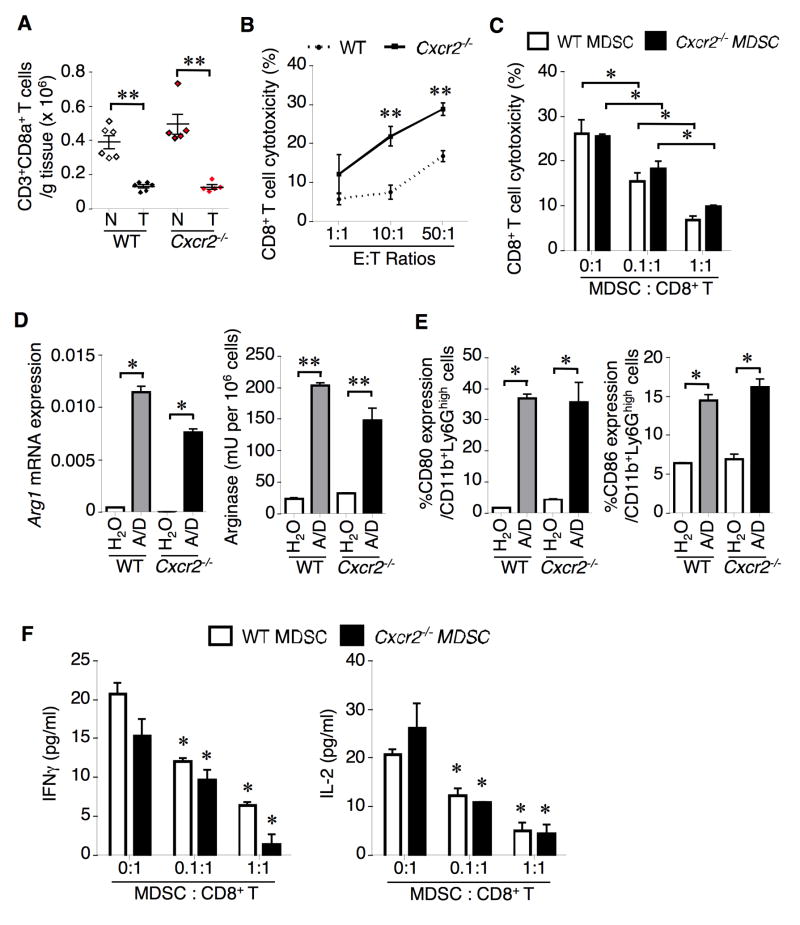
A large body of evidence indicates that chronic inflammation is one of several key risk factors for cancer initiation, progression, and metastasis. However, the underlying mechanisms responsible for the contribution of inflammation and inflammatory mediators to cancer remain elusive. Here, we present genetic evidence that loss of CXCR2 dramatically suppresses chronic colonic inflammation and colitis-associated tumorigenesis through inhibiting infiltration of myeloid-derived suppressor cells (MDSCs) into colonic mucosa and tumors in a mouse model of colitis-associated cancer. CXCR2 ligands were elevated in inflamed colonic mucosa and tumors and induced MDSC chemotaxis. Adoptive transfer of wild-type MDSCs into Cxcr2(-/-) mice restored AOM/DSS-induced tumor progression. MDSCs accelerated tumor growth by inhibiting CD8(+) T cell cytotoxic activity.


Figures

Figure 1
Figure 1. Deletion of Cxcr2 attenuates AOM/DSS-induced colonic chronic inflammation and colitis-associated tumor formation, growth, and progression
(A) Schematic of mice treated with AOM and DSS (A/D). (B) The colon lengths were measured at the end of experiments. (C) Representative of H&E-stained sections from WT (top panel) and Cxcr2 null mice (bottom panel) (scale bar = 100 μm). (D) Blinded histological scoring of inflammation in colonic mucosa of mice was performed as described in Experimental Procedures. (E) Tumor number and size were measured under a dissecting microscope. (F) Left panel represents immunoreactive staining (brown) for Ki67 (scale bar = 50 μm) and the right panel represents the average numbers of Ki67+ cells in 4 fields of each slides from 8 mice for each group. (G) Representative of H&E-stained sections of colonic tissue with tumors from WT and Cxcr2 null mice are shown (scale bar = 100 μm). (H) Blinded histological scoring of average percentage of adenocarcinomas in total tumors from WT and Cxcr2-deficient mice. Data are represented as mean ± SEM (8 mice for each group). Asterisks represent statistical differences (* p<0.05, ** p<0.01).
Figure 2
Figure 2. Loss of CXCR2 inhibits DSS-induced a massive infiltration of MDSCs from circulatory system to colon
The indicated genotypic mice aged 8 weeks were treated with 4 cycles of 1.25% DSS and the cells isolated from indicated organs were subjected to Flow Cytometry analysis. Viable granulocytes/monocytes or total cells were gated in a FSC/SSC plot. (A) The subpopulation of G-MDSCs in colonic mucosa was represented as percentage of gated granulocytes/monocytes cells (left panel) or as the numbers of G-MDSCs per gram of each mouse colon tissue (right panel). Each dot in the right panel represents the numbers of G-MDSCs in colonic mucosa taken from one mouse. (B) The profiles of G-MDSCs and monocytic MDSCs in colonic mucosa of water- or DSS-treated WT mice as mentioned above. (C) Data represents the percentage of G-MDSC in total viable cells from bone marrow (BM) and peripheral blood taken from mice. (D) Data represents the percentage of CXCR2+ MDSCs in total G-MDSCs from BM and blood in WT mice. (E) The percentage of CXCR2+ G-MDSCs and monocytic MDSCs in total G-MDSCs and monocytic MDSCs. The error bar indicates ± SEM. *p<0.05, ** p<0.01. See also Figure S1.
Figure 3
Figure 3. Loss of CXCR2 inhibits AOM/DSS-induced a massive infiltration of G-MDSCs from circulatory system to colonic mucosa and tumors
(A–B) G-MDSC percentage in bone marrow and peripheral blood (panel A) and G-MDSC numbers in tumors (T) and adjacent mucosa (N) (panel B) of mice treated with AOM/DSS were analyzed by Flow Cytometry as described Figure 1A. Each dot represents the percentage of G-MDSCs in BM and peripheral blood collected from one mouse (left panel) and the numbers of G-MDSCs in colonic tumors and matched mucosa taken from one mouse (right panel). The error bar indicates SEM. See also Figure S2.
Figure 4
Figure 4. CXCR2 ligands are elevated in colitis-associated tumor and matched inflamed mucosa
(A) CXCL1, CXCL2, and CXCL5 protein levels were measured in tumors (T) and adjacent mucosa (N) taken from mice treated with AOM/DSS as well as in normal colon tissues taken from mice fed with water only as described in Figure 1A. (B) CXCL1, CXCL2, and CXCL5 induced chemotaxis in WT MDSCs but not in Cxcr2−/− MDSCs in vitro. WT and Cxcr2−/− MDSCs were isolated from blood of AOM/DSS-treated WT and Cxcr2−/− mice, respectively. Values are reported as the mean ± SEM (6 mice for each group). *p<0.05; **p<0.01. See also Figure S3.
Figure 5
Figure 5. PGE2 treatment increased expression of CXCL1 and CXCL2 in colonic mucosa and tumors
Eight weeks old male BALBc mice were treated with either 2 cycles of DSS alone (panel A) or AOM plus 3 cycles of DSS (panel B) with PGE2 or vehicle as described in Experimental Procedures. The protein levels of CXCL1, CXCL2 and CXCL5 in colon (panel A) and colonic tumor (T) and matched mucosa (N) (panel B) were determined by ELISA. Data are represented as mean ± SEM (5 mice for each group). *p<0.05; **p<0.01. See also Figure S4.
Figure 6
Figure 6. Transfer of WT MDSCs to Cxcr2-deficent mice restores AOM/DSS-induced colitis-associated tumorigenesis
WT G-MDSCs, Ly6G immune cells (non-MDSC), or Cxcr2−/− G-MDSCs were intravenously (i.v.) injected into Cxcr2−/− mice as described in Experimental Procedures. The mice were treated with AOM/DSS as described in Experimental Procedures. (A) Gross view of colonic tumor of AOM/DSS-treated WT and Cxcr2−/− mice with non-MDSC immune cells, G-MDSCs, or Cxcr2-deficient G-MDSCs (Scale bar=0.5 cm). (B) Tumor number was counted based on the size. The data were represented as mean ± SEM of average of the tumor number in each size group and all groups. (C) Representative of H&E-stained sections of tumors from each group (scale bar = 100 μm). (D) Blinded histological scoring of average percentage of adenocarcinomas from WT and Cxcr2−/− mice with non-MDSC immune cells, WT MDSCs or Cxcr2−/− MDSCs. (E) The numbers of colonic MDSCs in WT mice or Cxcr2−/− mice treated with AOM and 2 cycles of DSS after transfer injection of indicated cells. Data are represented as mean ± SEM. *p<0.05; **p<0.01. See also Figure S5.
Figure 7
Figure 7. Loss of CXCR2 does not affect CD3+CD8+ T cell number but enhances CD8+ T cell cytotoxicity against tumor cells
(A) CD3+CD8+ cell number in tumors (T) and adjacent mucosa (N) taken from WT and Cxcr2−/− mice were determined by flow cytometry. (B) Cytotoxicity of colonic CD8+ T cells isolated from WT and Cxcr2−/− mice (E) against tumor cells (T) isolated from tumors of AOM/DSS-treated WT mice was determined as described in Experimental Procedures. (C) CD8+ T cells isolated from WT and Cxcr2−/− mice, tumor cells isolated from tumors of AOM/DSS-treated WT mice, and MDSCs isolated from blood of either WT or Cxcr2−/− mice were cultured. The ratio of CD8+ T cells and tumor cells is 50:1. (D) The levels of arginase 1 expression (left panel) and arginase activity (right panel) in colonic MDSCs isolated from indicated mice treated with water or AOM/DSS (A/D). (E) The percentage of CD80+ or CD86+ MDSCs in colonic MDSCs from indicated mice. (F) Levels of IFNγ and IL-2 secreted from WT CD8+ T cells cocultured with tumor cells (E:T=50:1) in the presence of different ratios of MDSCs from indicated mice. Data are represented as mean ± SEM (6 mice for each group). *p<0.05; **p<0.01. See also Figure S6 and Table S1.

References

    1. Abdallah Hajj Hussein I, Freund JN, Reimund JM, Shams A, Yamine M, Leone A, Jurjus AR. Enteropathogenic e.coli sustains iodoacetamide-induced ulcerative colitis-like colitis in rats: modulation of IL-1beta, IL-6, TNF-alpha, COX-2, and apoptosisi. Journal of biological regulators and homeostatic agents. 2012;26:515–526. - PubMed
    1. Acharyya S, Oskarsson T, Vanharanta S, Malladi S, Kim J, Morris PG, Manova-Todorova K, Leversha M, Hogg N, Seshan VE, et al. A CXCL1 paracrine network links cancer chemoresistance and metastasis. Cell. 2012;150:165–178. - PMC - PubMed
    1. Alzoghaibi MA, Al-Mofleh IA, Al-Jebreen AM. Neutrophil chemokines GCP-2 and GRO-alpha in patients with inflammatory bowel disease. J Dig Dis. 2008;9:144–148. - PubMed
    1. Andres PG, Beck PL, Mizoguchi E, Mizoguchi A, Bhan AK, Dawson T, Kuziel WA, Maeda N, MacDermott RP, Podolsky DK, Reinecker HC. Mice with a selective deletion of the CC chemokine receptors 5 or 2 are protected from dextran sodium sulfate-mediated colitis: lack of CC chemokine receptor 5 expression results in a NK1.1+ lymphocyte-associated Th2-type immune response in the intestine. J Immunol. 2000;164:6303–6312. - PubMed
    1. Asfaha S, Dubeykovskiy AN, Tomita H, Yang X, Stokes S, Shibata W, Friedman RA, Ariyama H, Dubeykovskaya ZA, Muthupalani S, et al. Mice that express human interleukin-8 have increased mobilization of immature myeloid cells, which exacerbates inflammation and accelerates colon carcinogenesis. Gastroenterology. 2013;144:155–166. - PMC - PubMed

Publication types

MeSH terms