. 2013 Nov 11;24(5):645-59.
doi: 10.1016/j.ccr.2013.09.021.

Skp2 deletion unmasks a p27 safeguard that blocks tumorigenesis in the absence of pRb and p53 tumor suppressors

Affiliations

Skp2 deletion unmasks a p27 safeguard that blocks tumorigenesis in the absence of pRb and p53 tumor suppressors

Hongling Zhao et al. Cancer Cell. .

Abstract

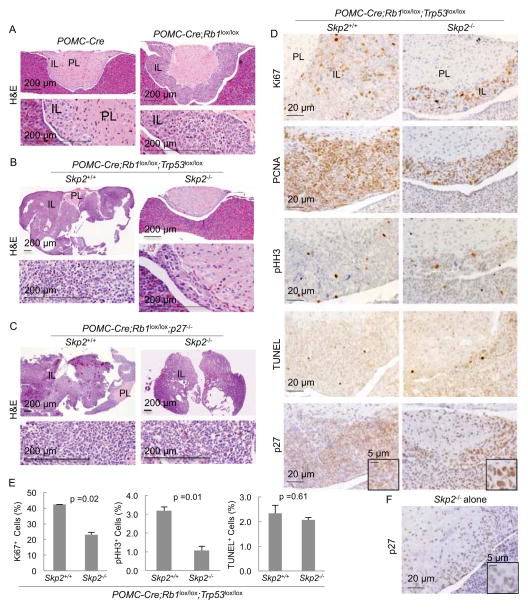
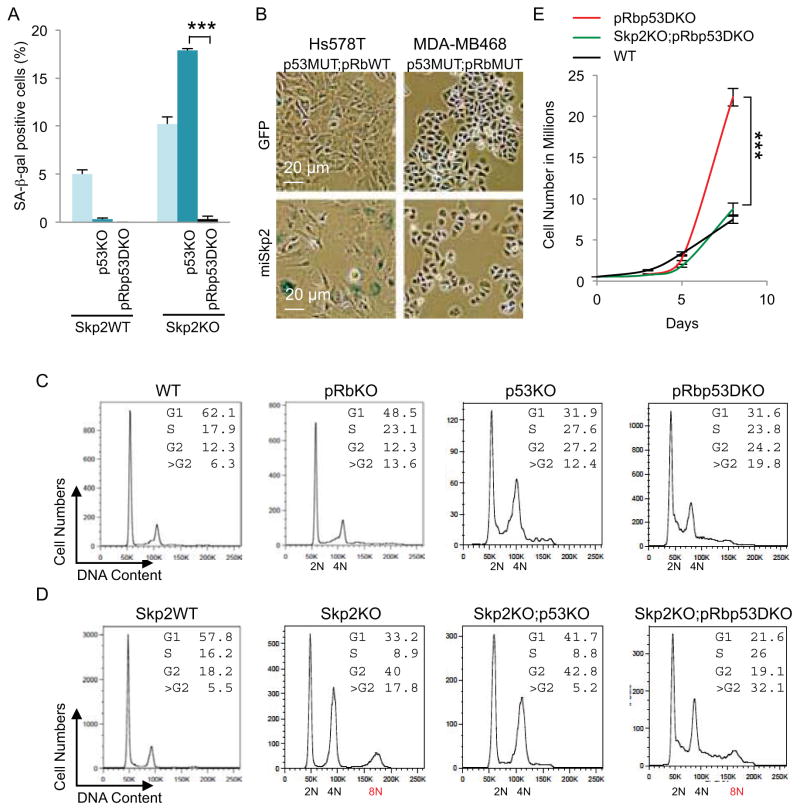
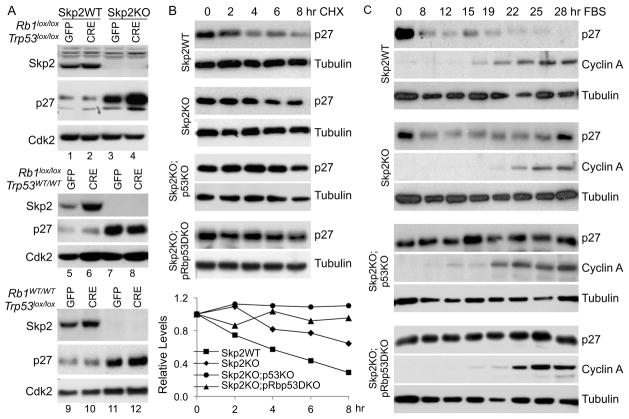
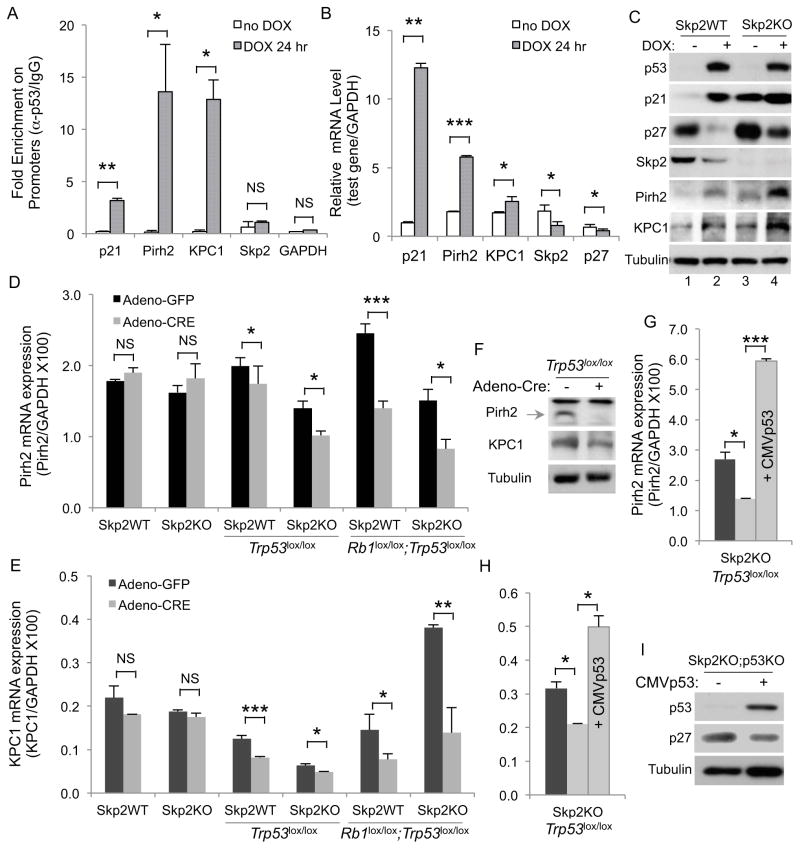
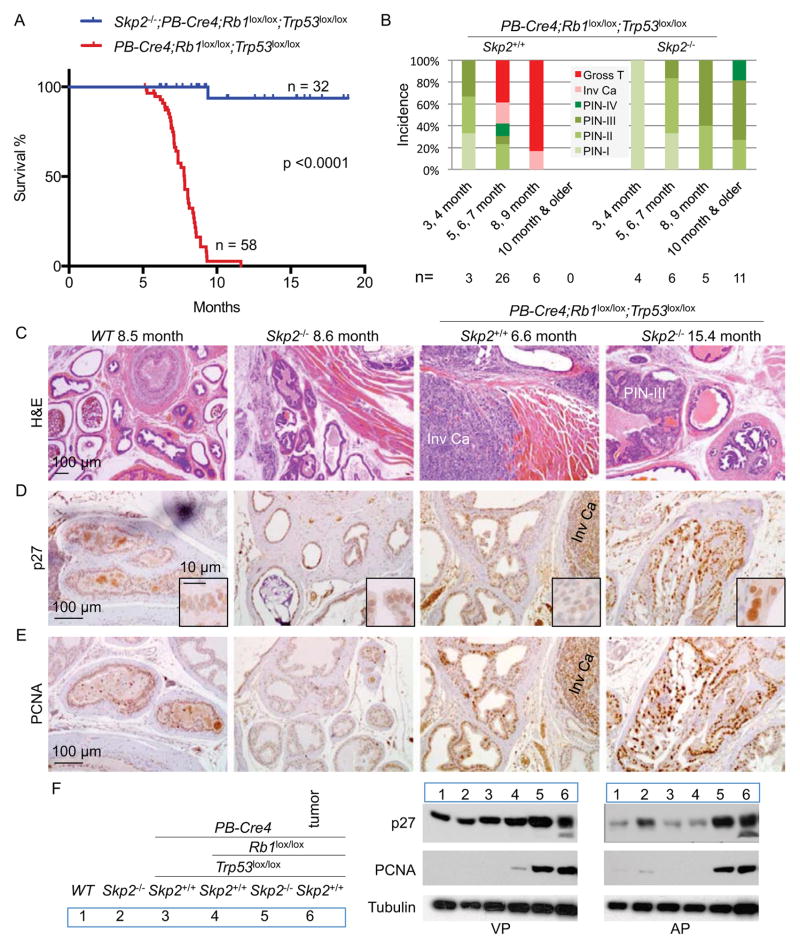
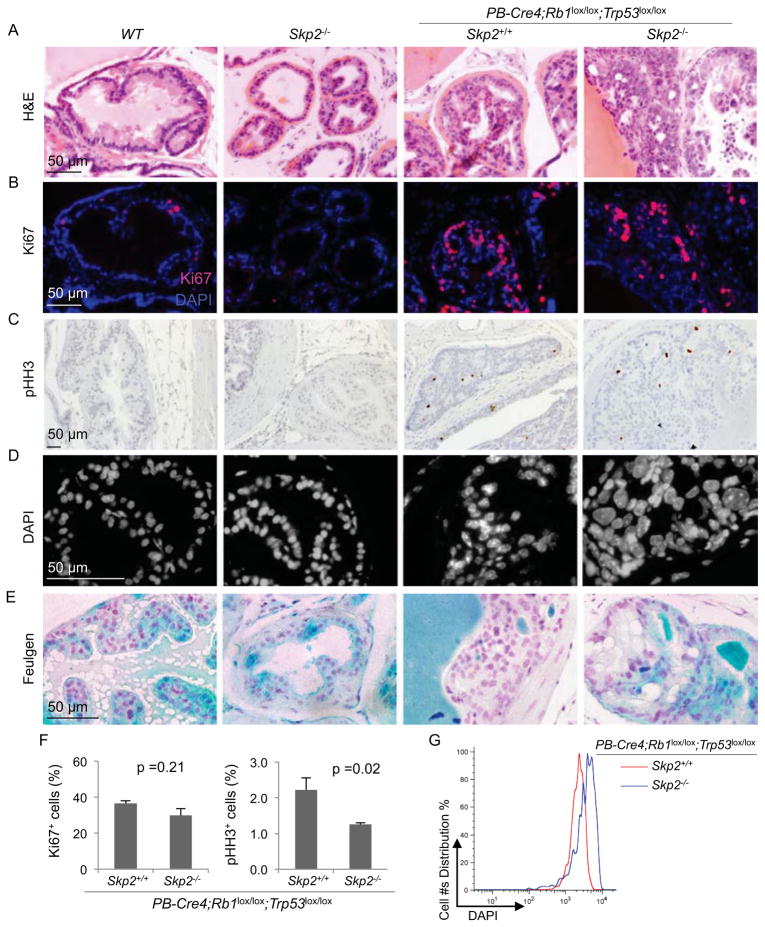
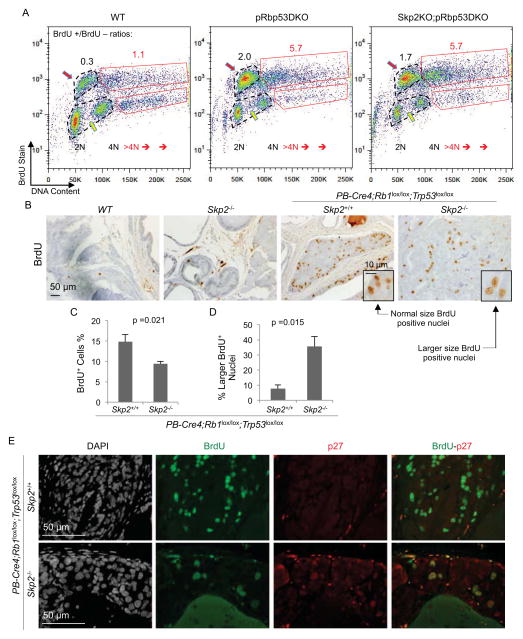
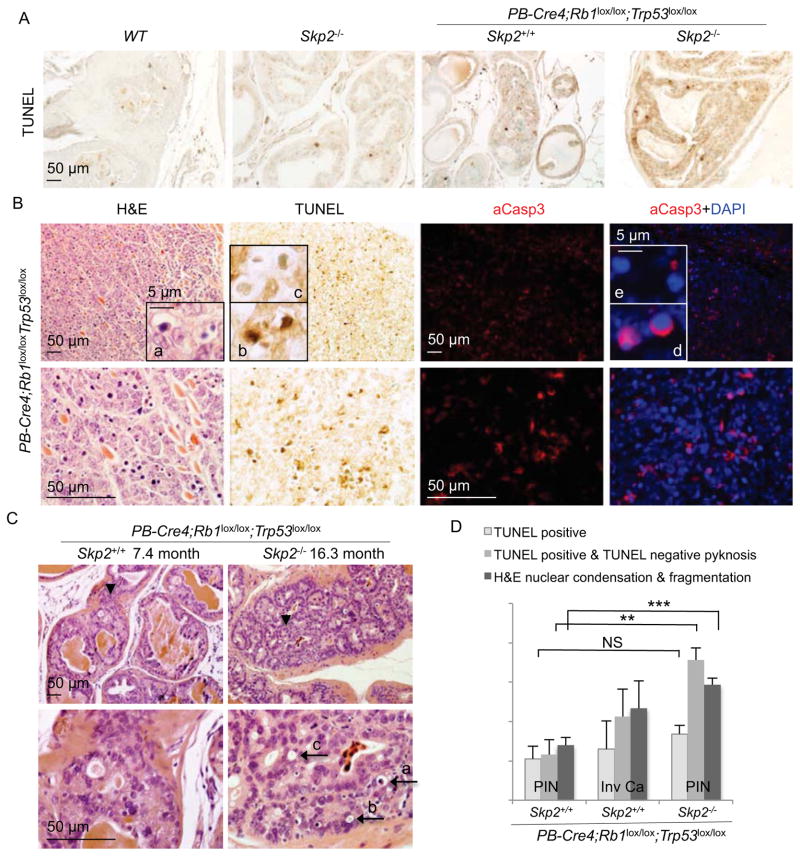
pRb and p53 are two major tumor suppressors. Here, we found that p53 activates expression of Pirh2 and KPC1, two of the three ubiquitin ligases for p27. Loss of p53 in the absence of Skp2, the third ubiquitin ligase for p27, shrinks the cellular pool of p27 ubiquitin ligases to accumulate p27 protein. In the absence of pRb and p53, p27 was unable to inhibit DNA synthesis in spite of its abundance, but could inhibit division of cells that maintain DNA replication with rereplication. This mechanism blocked pRb/p53 doubly deficient pituitary and prostate tumorigenesis lastingly coexistent with bromodeoxyuridine-labeling neoplastic lesions, revealing an unconventional cancer cell vulnerability when pRb and p53 are inactivated.


Figures

Figure 1
Figure 1. Skp2 deletion blocks pRb and p53 doubly deficient, but not pRb and p27 doubly deficient, pituitary tumorigenesis
(A–C) H&E sections of pituitary samples at 7 weeks of age. Higher magnification views of the IL are presented under lower magnification ones. (D) Pituitary sections of indicated genotypes were stained as indicated. For the Skp2+/+;POMC-Cre;Rb1lox/lox;Trp53lox/lox genotype, we selected pituitaries that were not deformed by macroscopic tumors. (E) Quantification of Ki67, pHH3, or TUNEL stain positive cells in (D). (F) A representative image of Skp2−/− pituitaries stained for p27. IL, intermediate lobe; PL, posterior lobe. Scales bars are as marked. Quantitative data are presented as average +/− SEM. Statistical analyses were by Student’s t test. See also Figure S1.
Figure 2
Figure 2. Skp2, Rb1 and Trp53 triply deficient MEFs show higher DNA replication and re-replication, accumulation at 8N, and proliferation speed of WT MEFs
(A) Quantification of senescence marker SA-β-gal in MEFs of the indicated genotypes. (B) Human breast cancer cell lines with known pRb and p53 status (as indicated) were transduced with lentiviruses expressing GFP or miRNA haipins targeting Skp2 (miSkp2). Five days after transduction, same numbers of cells were plated. SA-β-gal staining was performed three days later. (C and D) DNA content FACS analysis of MEFs with indicated genotypes. (E) Cell proliferation of the indicated MEFs is measured by counting cell numbers. Quantitative data are presented as average +/− SEM. Statistical analyses were by Student’s t test. ***, p < 0.002. FACS results are representative of three experiments. See also Figure S2.
Figure 3
Figure 3. Deletion of Trp53 triggers further stabilization of p27 protein in Skp2KO MEFs
(A) Western blot analysis of indicated proteins in MEFs of indicated genotypes transduced in parallel by Adeno-GFP or Adeno-CRE. (B) Cell extracts were prepared from MEFs of indicated genotypes at the indicated time points following the addition of cyclohexamide (CHX), and the amounts of p27 protein were measured by Western blot in comparison to tubulin. p27 protein level quantification is presented under the gels. (C) Cell extracts were prepared from MEFs of indicated genotypes at indicated time points after being cultured in serum containing media following serum starvation for three days. The p27 protein level was determined by Western blot. The cyclin A protein level is shown to indicate cell cycle progression and the tubulin level is shown to indicate loading amounts. See also Figure S3.
Figure 4
Figure 4. p27 ubiquitin ligases Pirh2 and KPC1 are p53 target genes
(A) ChIP with anti-p53 and control IgG following DOX treatment of WT MEFs. Fold enrichment (anti-p53/IgG) for the indicated promoters is presented. (B) RT-qPCR of the indicated genes in WT MEFs following DOX treatment, normalized with GAPDH. (C) Western blot of the indicated MEFs following treatment with DOX as in (B). (D and E) Expression of Pirh2 (D) and KPC1 (E), in MEFs transduced in parallel by Adeno-GFP and Adeno-CRE, values were normalized with GAPDH. (F) Western blots of Pirh2 and KPC1 before and after deletion of Trp53. (G and H) Same as (D and E) with an additional sample in which p53 was ectopically expressed, as marked inside the bars. (I) Western blots of Skp2KO;p53KO MEFs without or with ectopic p53 expression. Quantitative data are presented as average +/− SEM. Student’s t test was used for statistical analysis. *, p <0.05; **, p < 0.01; ***, p < 0.002; NS, p >0.05. See also Figure S4.
Figure 5
Figure 5. Deletion of Skp2 blocks pRb and p53 doubly deficient prostate tumorigenesis inside PIN stages
(A) Kaplan-Meier survival analysis of two cohorts of mice with indicated genotypes. One Skp2−/−;PB-Cre4;Rb1lox/lox;Trp53lox/lox mouse died from fighting at 9.4 months without prostate tumors. (B) Pathological diagnoses of prostate lesions in mice of indicated genotypes in four age groups. Each prostate was serially sectioned and the most advanced lesions were the diagnoses. (C–E) Sections of prostates from mice of four genotypes at the indicated ages stained with H&E (C), anti-p27 (D) and anti-PCNA (E). Invasive carcinoma (Inv Ca) and a PIN-III lesion are marked. (F) Western blots of isolated ventral prostates (VP) and anterior prostates (AP) from 3–4 month old mice. A macroscopic tumor was included as marked. See also Figure S5.
Figure 6
Figure 6. Comparisons of proliferation markers and nuclear sizes in prostate of the indicated genotypes
(A–E) Sections of prostates from mice with indicated genotypes at same ages as those shown in Figure 5C were stained with H&E (A), anti-Ki67 (B), anti-pHH3 (C), DAPI (D), and Feulgen (E). (F) Quantification of Ki67 positive cells and pHH3 positive cells from (B) and (C), respectively. (G) DAPI stained slides were quantified by iCys® Research Imaging Cytometer and iCys® Cytometric Analysis Software. Quantitative data are presented as average +/− SEM. Student’s t test was used for statistical analysis.
Figure 7
Figure 7. Sustained active DNA synthesis in Skp2KO;pRbp53DKO MEFs and in Skp2−/−;PB-Cre4;Rb1lox/lox;Trp53lox/lox PINs
(A) Representative (from three experiments) FACS plots of DNA content by PI and BrdU content by anti-BrdU. Numbers of BrdU positive and negative cells in regular cell cycle were determined within the dotted black circles, and the ratios indicated in black numbers above the circles. Numbers of cells with >4N DNA contents were similarly analyzed with red boxes and red numbers. (B and C) Prostate sections from BrdU injected mice with indicated genotypes were stained with BrdU (B), quantification of BrdU positive cells was shown in (C). (D) Quantification of normal sized and larger sized BrdU positive nuclei as portions of the entire BrdU positive cell populations. (E) Prostates sections from BrdU injected mice with indicated genotypes were stained with DAPI, anti-BrdU and anti-p27. The Skp2−/−;PB-Cre4;Rb1lox/lox;Trp53lox/lox sample was from a 21.7 months old mouse, showing persistence of PIN cells containing enlarged nuclei with high p27 and BrdU incorporation. Quantitative data in (C and D) are presented as average +/− SEM. Student’s t test was used for statistical analysis. See also Figure S6.
Figure 8
Figure 8. Blocked Skp2−/−;PB-Cre4;Rb1lox/lox;Trp53lox/lox PIN cells succumb to apoptosis
(A) TUNEL staining of prostate sections of the indicated genotypes. (B) Comparison of apoptosis detection by nuclear morphology (insert a), TUNEL stain (inserts b and c), and aCasp3 and DAPI costains (inserts d and e) in a microscopic tumor. (C) Representative H&E stained prostate PIN section of the indicated genotypes. Lower panels show higher magnification views of areas pointed by black arrowheads in the corresponding upper panels. Black arrows point to typical apoptotic morphologies, as described in text. (D) Quantification of apoptosis rates in the indicated lesions by three different methods as marked. Quantitative data are presented as average +/− SEM. Student’s t test was used for statistical analysis. **, p < 0.01; ***, p < 0.002; NS, p >0.05. See also Figure S7.

Similar articles

Cited by

References

    1. Arias EE, Walter JC. Strength in numbers: preventing rereplication via multiple mechanisms in eukaryotic cells. Genes Dev. 2007;21:497–518. - PubMed
    1. Balthasar N, Coppari R, McMinn J, Liu SM, Lee CE, Tang V, Kenny CD, McGovern RA, Chua SC, Jr, Elmquist JK, et al. Leptin receptor signaling in POMC neurons is required for normal body weight homeostasis. Neuron. 2004;42:983–891. - PubMed
    1. Berman SD, Calo E, Landman AS, Danielian PS, Miller ES, West JC, Fonhoue BD, Caron A, Bronson R, Bouxsein ML, et al. Metastatic osteosarcoma induced by inactivation of Rb and p53 in the osteoblast lineage. Proc Natl Acad Sci U S A. 2008;105:11851–11856. - PMC - PubMed
    1. Burkhart DL, Sage J. Cellular mechanisms of tumour suppression by the retinoblastoma gene. Nature reviews Cancer. 2008;8:671–682. - PMC - PubMed
    1. Cao X, Xue L, Han L, Ma L, Chen T, Tong T. WW domain-containing E3 ubiquitin protein ligase 1 (WWP1) delays cellular senescence by promoting p27(Kip1) degradation in human diploid fibroblasts. J Biol Chem. 2011;286:33447–33456. - PMC - PubMed

MeSH terms