. 2013 Dec;123(12):5119-34.
doi: 10.1172/JCI69076. Epub 2013 Nov 15.

Systems pharmacology identifies drug targets for Stargardt disease-associated retinal degeneration

Systems pharmacology identifies drug targets for Stargardt disease-associated retinal degeneration

Yu Chen et al. J Clin Invest. 2013 Dec.

Abstract

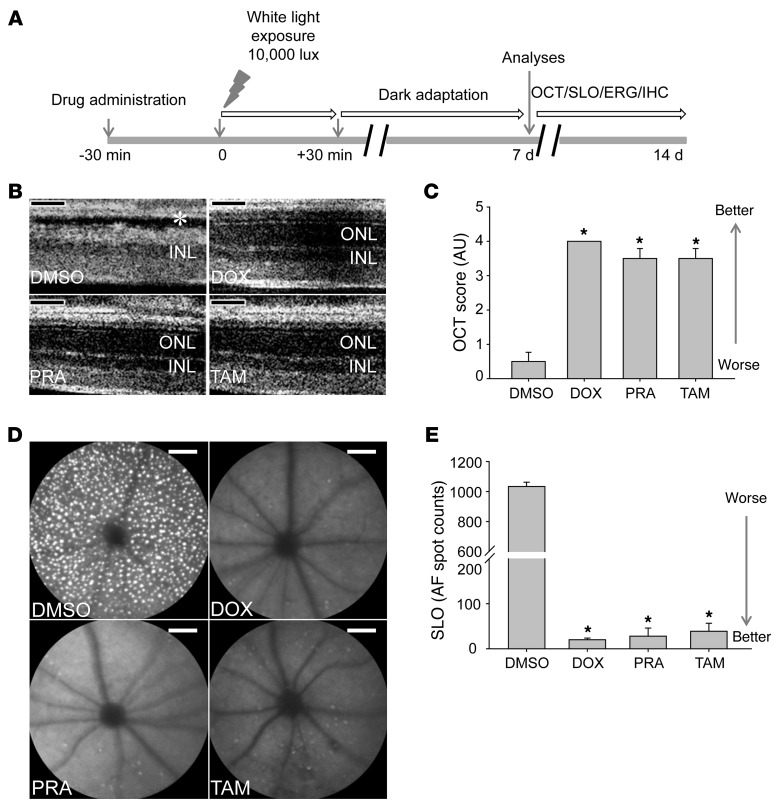
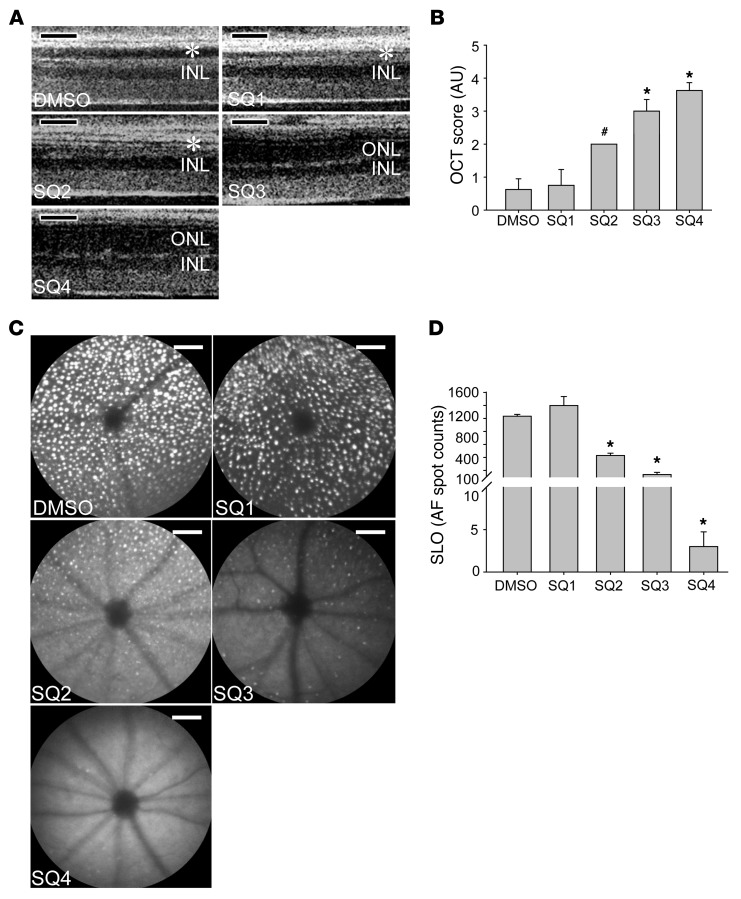
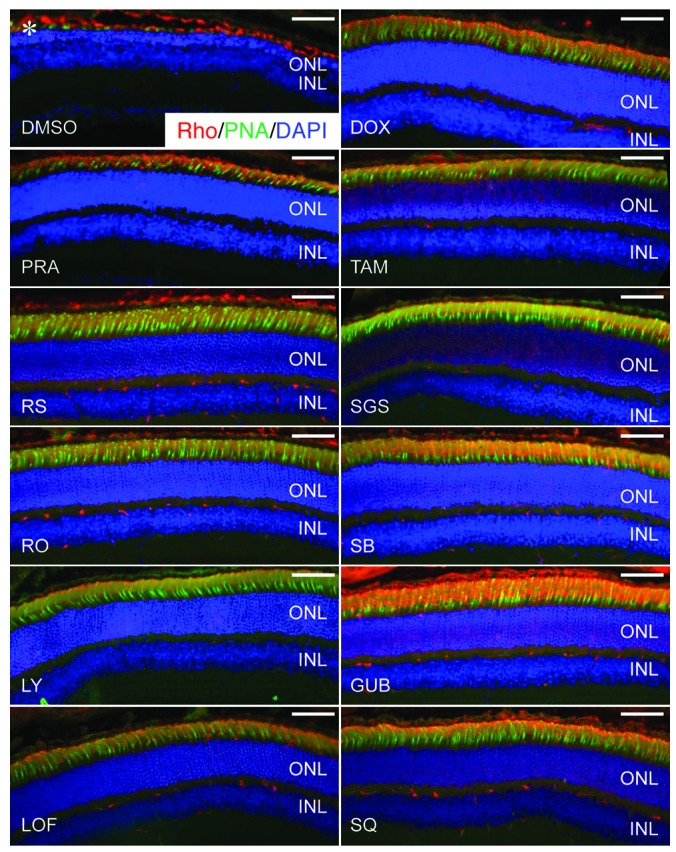
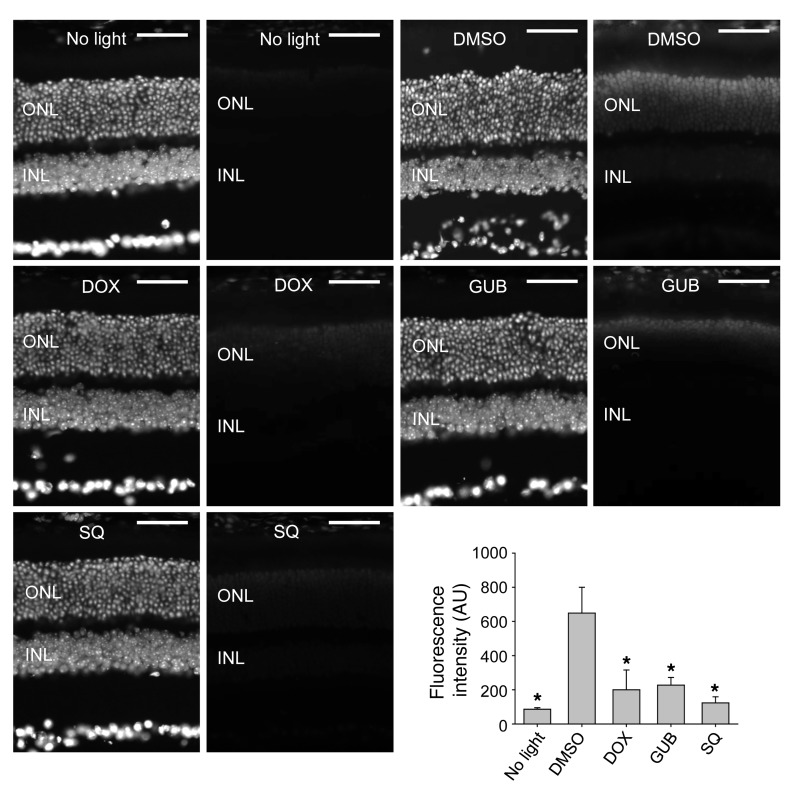
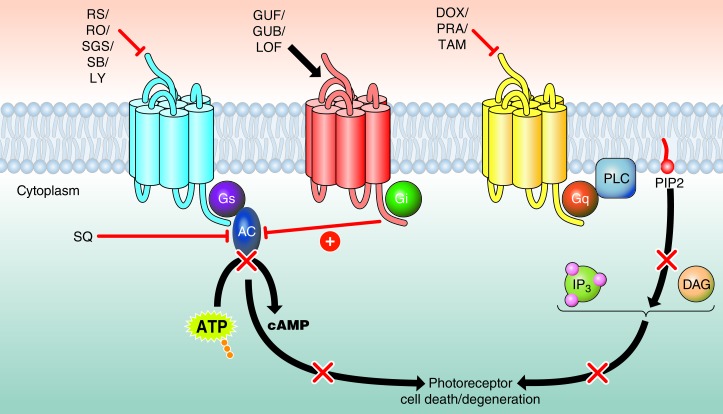
A systems pharmacological approach that capitalizes on the characterization of intracellular signaling networks can transform our understanding of human diseases and lead to therapy development. Here, we applied this strategy to identify pharmacological targets for the treatment of Stargardt disease, a severe juvenile form of macular degeneration. Diverse GPCRs have previously been implicated in neuronal cell survival, and crosstalk between GPCR signaling pathways represents an unexplored avenue for pharmacological intervention. We focused on this receptor family for potential therapeutic interventions in macular disease. Complete transcriptomes of mouse and human samples were analyzed to assess the expression of GPCRs in the retina. Focusing on adrenergic (AR) and serotonin (5-HT) receptors, we found that adrenoceptor α 2C (Adra2c) and serotonin receptor 2a (Htr2a) were the most highly expressed. Using a mouse model of Stargardt disease, we found that pharmacological interventions that targeted both GPCR signaling pathways and adenylate cyclases (ACs) improved photoreceptor cell survival, preserved photoreceptor function, and attenuated the accumulation of pathological fluorescent deposits in the retina. These findings demonstrate a strategy for the identification of new drug candidates and FDA-approved drugs for the treatment of monogenic and complex diseases.


Figures

Figure 1
Figure 1. Antagonists of the α1-AR, a Gq-coupled GPCR, protect Abca4–/–Rdh8–/– mouse retinas from bright light–induced degeneration.
(A) Schematic protocol for pharmacological treatment. All pharmacological compounds tested were administered via i.p. injection to 4- to 5-week-old Abca4–/–Rdh8–/– mice 30 minutes prior to white light exposure at 10,000 lux for 30 minutes. After light exposure, mice were kept in the dark for 7 to 14 days before functional and morphological examination by ERG, OCT, SLO, and IHC. (B) α1-AR antagonists, including DOX, PRA, and TAM, or DMSO vehicle were administered to Abca4–/–Rdh8–/– mice 30 minutes prior to white light exposure. OCT imaging was performed 7 days later to evaluate retinal morphology, and representative OCT images are shown. Asterisk indicates severely disrupted photoreceptor structures in vehicle-treated animals. ONL, outer nuclear layer; INL inner nuclear layer. (C) OCT scores from different treatment groups were subjected to statistical analysis (means ± SEM; *P < 0.01 compared with DMSO control). (D) SLO imaging was performed 8 days after light exposure, and retinal autofluorescence images are shown. (E) Numbers of retinal autofluorescence (AF) spots were counted and subjected to statistical analysis (means ± SEM; *P < 0.01 compared with DMSO control). Scale bars: 50 μm.
Figure 2
Figure 2. Agonists of the α2-AR, a Gi-coupled GPCR, protect Abca4–/–Rdh8–/– mouse retinas from bright light–induced degeneration.
The α2-AR agonists LOF, GUB, and GUF were administered to 4- to 5-week-old Abca4–/–Rdh8–/– mice by i.p. injection 30 minutes prior to white light exposure at 10,000 lux for 30 minutes. DMSO was used as a vehicle control. (A) OCT imaging was performed to evaluate the effect of each treatment 7 days after light exposure. Asterisk indicates a markedly damaged photoreceptor structure in vehicle-treated control animals. (B) Statistical analysis of OCT scores (means ± SEM; *P < 0.01 compared to DMSO control). (C) SLO imaging was performed to detect autofluorescence 8 days after light exposure. Representative retinal autofluorescence images correlated positively with retinal damage. (D) SLO autofluorescence spot counts were further analyzed for statistical significance (means ± SEM; *P < 0.01 compared to DMSO control). Retinal autofluorescence images correlated positively with retinal damage revealed by OCT imaging. Scale bars indicate 50 μm.
Figure 3
Figure 3. Multiple pharmacological antagonists of Gs-coupled GPCRs protect Abca4–/–Rdh8–/– mouse retinas from light-induced damage.
RS, a 5-HT4R antagonist; SGS and RO, selective 5-HT6R antagonists; SB, and LY, 5-HT7R antagonists; and the DMSO vehicle control were each administered to 4- to 5-week-old Abca4–/–Rdh8–/– mice by i.p. injection 30 minutes prior to white light exposure at 10,000 lux for 30 minutes. (A) The effect of each treatment was examined by OCT imaging 7 days after light exposure. Representative OCT images featured a disrupted photoreceptor structure only in the DMSO control, as indicated by the asterisk. (B) Statistically analyzed OCT scores (means ± SEM; *P < 0.01 compared with DMSO control). (C) SLO imaging was performed 8 days after light exposure. Representative retinal autofluorescence images show protection by all agents except DMSO. (D) Numbers of retinal autofluorescent spots were counted and statistically analyzed (means ± SEM; *P < 0.01 compared with DMSO control). Scale bars: 50 μm.
Figure 4
Figure 4. The selective AC inhibitor SQ protects Abca4–/–Rdh8–/– mouse retinas against bright light–induced damage in a dose-dependent fashion.
Increasing doses of SQ were administered to 4- to 5-week-old Abca4–/–Rdh8–/– mice by i.p. injection 30 minutes prior to white light exposure at 10,000 lux for 30 minutes. Doses were: SQ1: 0.083 mg/kg; SQ2: 0.125 mg/kg; SQ3: 0.25 mg/kg; and SQ4: 0.5 mg/kg. (A) The effect of SQ pretreatment was assessed by OCT imaging 7 days after light exposure. OCT images indicate damaged photoreceptor structures in DMSO-treated and a dose-dependent preservation of photoreceptor morphology in SQ-treated mice (asterisks identify damaged ONL). (B) Statistical analysis of OCT scores (means ± SEM; #P < 0.05 and *P < 0.01 compared with DMSO control). (C) Retinal autofluorescence was examined by SLO imaging 8 days after light exposure. Representative retinal autofluorescent images reveal numbers and densities of bright spots that correlated with retinal damage. (D) Statistical analysis of the numbers of SLO autofluorescence spots (means ± SEM; *P < 0.01 compared with DMSO control). Scale bars: 50 μm.
Figure 5
Figure 5. IHC examination shows protective effects on retinal morphology exerted by therapeutics targeting Gq-, Gs-, and Gi-coupled GPCRs and AC in Abca4–/–Rdh8–/– mice.
Retinal morphological changes after various indicated pretreatments were further evaluated by photoreceptor IHC examination (asterisk identifies severely reduced photoreceptor outer and inner segments manifested by only residual staining of rhodopsin and PNA in DMSO-treated control mice). Rho staining (red); PNA staining of cone extracellular matrix (green); DAPI staining of nuclei (blue). Scale bars: 50 μm.
Figure 6
Figure 6. Contributions of Gi and Gq pathways to light-induced retinal pathogenesis.
(A) GUB, a Gi pathway activator, protected Abca4–/–Rdh8–/– mouse retinas from bright light–induced degeneration in a dose-dependent fashion with a half-maximal effective dose of 0.3 mg/kg. n ≥ 5 for each data point. (B) The Gq pathway inhibitor DOX also protected mouse retinas from bright light–induced degeneration in a dose-dependent fashion with a half-maximal effective dose of 0.4 mg/kg. n ≥ 5 for each data point. (C) The combination of GUB at 0.3 mg/kg BW and DOX at 0.4 mg/kg BW protected the retina in at least an additive manner; n ≥ 5. (D) IDA at 2.5 mg/kg BW and 5 mg/kg BW counteracted the protective action of GUB at 2 mg/kg BW on bright light–induced retinal degeneration; n ≥ 5.
Figure 7
Figure 7. Therapeutics targeting Gq-, Gs-, and Gi-coupled GPCRs and AC preserve retinal function in 4- to 5-week-old Abca4–/–Rdh8–/– mice.
Abca4–/–Rdh8–/– mice were exposed to 10,000 lux light for 30 minutes after pretreatment with the pharmacological agents DOX (10 mg/kg BW), LOF (2 mg/kg BW), LY (10 mg/kg BW), RO (30 mg/kg BW), RS (20 mg/kg BW), and SQ (0.5 mg/kg BW). ERGs were recorded to evaluate the effects of these agents on retinal function 2 weeks after light exposure. (A) ERG responses were compared between mice not exposed to intense light (No light), vehicle only (DMSO), and tested agents under both scotopic and photopic conditions. Amplitudes of B waves at 1.6 log cd × s/m2 under scotopic and photopic conditions are shown (B). Tested compounds showed significant protective effects when compared with DMSO-treated mice, which displayed significantly impaired retinal function as indicated by decreased ERG amplitudes. *P < 0.05 compared with DMSO control. Bars indicate SDs. n = 4–6 eyes per group.
Figure 8
Figure 8. DOX, GUB, and SQ each prevent light-induced retinal degeneration in WT mice.
The α1-AR antagonist DOX, the α2-AR agonist GUB, or the AC inhibitor SQ was given to 4-week-old WT BALB/c mice by i.p. injection 30 minutes prior to white light exposure at 10,000 lux for 1 hour. BALB/c mice were used to reduce absorption of light by the RPE pigment. Doses of each compound were as follows: DOX, 10 mg/kg; GUB, 2.0 mg/kg; and SQ, 0.5 mg/kg. Effects of these compounds were evaluated by spectral domain optical coherence tomography (SD-OCT) imaging 7 days after light exposure. Representative images of SD-OCT 500 μm away from the optic nerve head in the superior retina are shown in the left panels. Asterisks indicate damaged photoreceptor structures evident only in DMSO-treated control mice. Retinal cross-sectional images of plastic sections (middle panels) were obtained from areas similar to those used for the OCT images. Retinal autofluorescence also was examined by SLO 7 days after light exposure (right panels). Numbers (means ± SEM) of bright spots are indicated at the right bottom of the SLO images. Scale bars: 50 μm.
Figure 9
Figure 9. ROS generation in photoreceptors of Abca4–/–Rdh8–/– mice after bright light exposure is decreased by either DOX, GUB, or SQ pretreatment.
Dark-adapted pigmented 4- to 5-week-old Abca4–/–Rdh8–/– mice were treated with the ROS probe DHE 1 hour prior to light exposure at 10,000 lux for 30 minutes. Either vehicle control (DMSO), DOX, GUB, or SQ were also administered by i.p. injection 30 minutes prior to light exposure. The dose of each compound was as follows: DOX,10 mg/kg; GUB, 2.0 mg/kg; SQ, 0.5 mg/kg. Dark-adapted Abca4–/–Rdh8–/– mice not exposed to light were included for DHE probe treatment as well (no light). Retinas were harvested 3 hours after illumination. ROS signals were obtained with the identical exposure setup under a fluorescence microscope (right panel of each image set). DAPI staining was performed as well to visualize cell nuclei and gross retinal structure (left panel of each image set). Recorded ROS fluorescence intensity in arbitrary units averaged from various areas was further analyzed and summarized for group comparisons (means ± SEM). *P < 0.05 compared with DMSO control. Scale bars: 50 μm.
Figure 10
Figure 10. Detection and quantification of DOX, GUB, and SQ in mouse eye.
(A) HPLC separation of SQ (peak 1), clenbuterol (IS) (peak 2), and GUB (peak 3). (BD) MS and MS2 patterns for SQ, clenbuterol, and GUB, respectively. Characteristic fragmentation profiles were used to design the selected reaction monitoring-based detection and quantification method. (E) Elution profile of PRA (IS) (peak 1) and DOX (peak 2). (F and G) MS and MS2 fragmentation pattern for PRA and DOX. (H) Relationship between ion intensities and molar ratio for drug/internal standard pairs (DOX/PRA [black triangles] and overlapping black and white circles for GUB/clenbuterol and SQ/clenbuterol, respectively), which were used for IS-based drug quantification. (IK) Representative chromatograms of the eye extract indicating the presence of DOX, GUB, and SQ, respectively. Black chromatograms correspond to ion intensities of SRM transitions characteristic for the tested drugs. Gray lines represent ion intensities for the ISs. Letters “T” and “C” discriminate between samples obtained from drug-treated mice (T) and control, nontreated animals (C).
Figure 11
Figure 11. GPCR-targeted therapeutics prevent formation of large fluorescent granules in the RPE of 6- to 7-week-old Abca4–/–Rdh8–/– mice after exposure to bright light.
(A) Representative TPM images of the RPE 10 days after exposure to bright light. Upper left panel, unexposed to light (No light) control; upper right panel, exposed to bright light (Bleached) and DMSO-treated control; lower left panel, pretreated with PRA; lower right panel, pretreated with GUB. Cross sections shown at the right edge and at the bottom of each en face RPE image reveal that fluorescent granules, most pronounced in the bleached DMSO-treated control, extend across the whole thickness of the RPE and into the outer retina-photoreceptor space. Scale bars: 25 μm. (B) Emission spectra after excitation with 730 nm light (left panel) and after excitation with 850 nm light (right panel). The spectra from light-exposed, DMSO-treated control are notably red-shifted for both excitation wavelengths.
Figure 12
Figure 12. Systems pharmacological strategies targeting multiple GPCRs can prevent the development of light-induced photoreceptor degeneration.
Antagonists of multiple Gs-coupled GPCRs prevented photoreceptor cell death (red bar, top left), implying that increased activity of Gs-coupled GPCRs with subsequent activation of AC (black arrow) could cause photoreceptor cell death. In contrast, pharmacological activation of α2-ARs, Gi-coupled GPCRs (black arrow, top middle) suppressed AC activity (red bar). Therefore, AC as the central player mediating Gs-coupled and Gi-coupled GPCR signaling could also serve as a direct therapeutic target to protect photoreceptors from bright light–induced degeneration. Consistent with this hypothesis, protection could also be achieved by directly inhibiting AC activity with an AC inhibitor (red bar, left middle). Additionally, consistent with our previous finding that Gq-coupled GPCRs participate in photoreceptor degeneration, inhibition of α1-AR, a Gq-coupled GPCR, also proved effective in protecting photoreceptors from light-induced degeneration (red bar, top right).

Similar articles

Cited by

References

    1. Bamshad MJ, et al. Exome sequencing as a tool for Mendelian disease gene discovery. Nat Rev Genet. 2011;12(11):745–755. - PubMed
    1. Ku CS, et al. Exome versus transcriptome sequencing in identifying coding region variants. Expert Rev Mol Diagn. 2012;12(3):241–251. doi: 10.1586/erm.12.10. - DOI - PubMed
    1. De Matteis MA, Luini A. Mendelian disorders of membrane trafficking. N Engl J Med. 2011;365(10):927–938. doi: 10.1056/NEJMra0910494. - DOI - PubMed
    1. Hubner N, et al. Integrated transcriptional profiling and linkage analysis for identification of genes underlying disease. Nat Genet. 2005;37(3):243–253. doi: 10.1038/ng1522. - DOI - PubMed
    1. Dermitzakis ET. Cellular genomics for complex traits. Nat Rev Genet. 2012;13(3):215–220. - PubMed

Publication types

MeSH terms

Substances