. 2013 Dec 15;21(24):7763-78.
doi: 10.1016/j.bmc.2013.10.015. Epub 2013 Oct 23.

Discovery of a novel activator of 5-lipoxygenase from an anacardic acid derived compound collection

Affiliations

Discovery of a novel activator of 5-lipoxygenase from an anacardic acid derived compound collection

Rosalina Wisastra et al. Bioorg Med Chem. .

Abstract

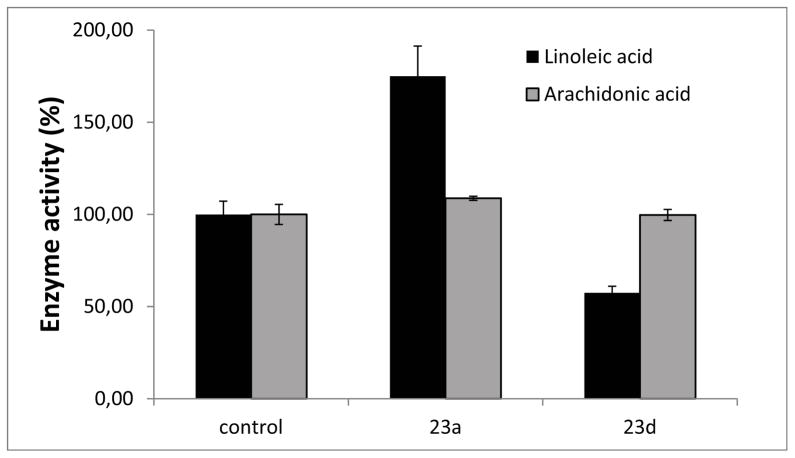
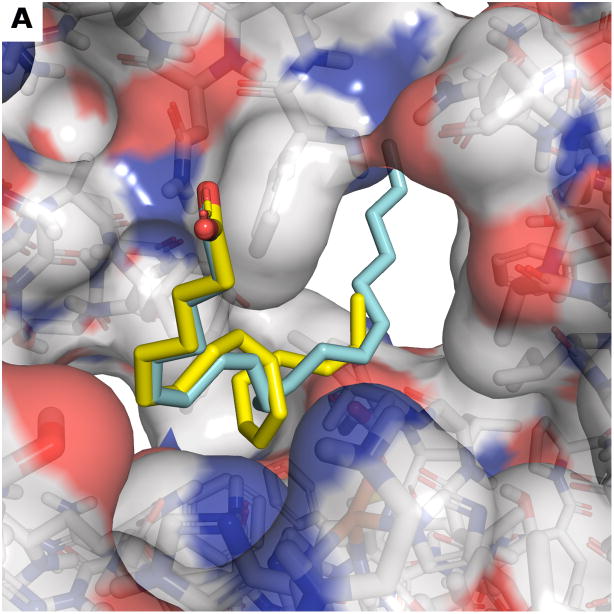
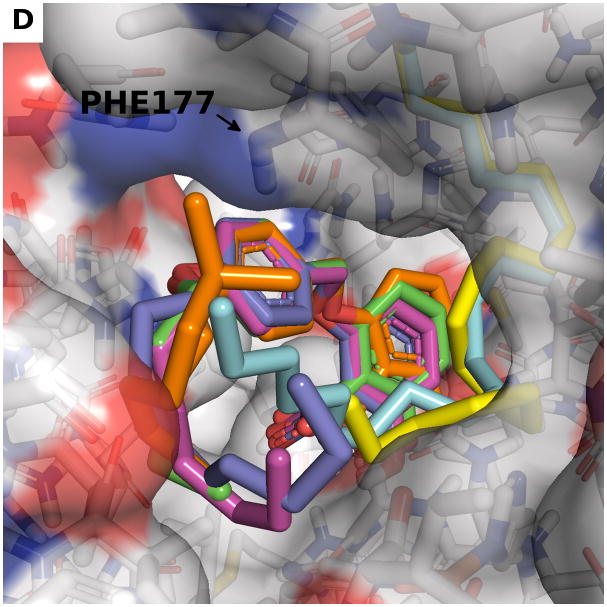
Lipoxygenases (LOXs) and cyclooxygenases (COXs) metabolize poly-unsaturated fatty acids into inflammatory signaling molecules. Modulation of the activity of these enzymes may provide new approaches for therapy of inflammatory diseases. In this study, we screened novel anacardic acid derivatives as modulators of human 5-LOX and COX-2 activity. Interestingly, a novel salicylate derivative 23a was identified as a surprisingly potent activator of human 5-LOX. This compound showed both non-competitive activation towards the human 5-LOX activator adenosine triphosphate (ATP) and non-essential mixed type activation against the substrate linoleic acid, while having no effect on the conversion of the substrate arachidonic acid. The kinetic analysis demonstrated a non-essential activation of the linoleic acid conversion with a KA of 8.65 μM, αKA of 0.38μM and a β value of 1.76. It is also of interest that a comparable derivative 23d showed a mixed type inhibition for linoleic acid conversion. These observations indicate the presence of an allosteric binding site in human 5-LOX distinct from the ATP binding site. The activatory and inhibitory behavior of 23a and 23d on the conversion of linoleic compared to arachidonic acid are rationalized by docking studies, which suggest that the activator 23a stabilizes linoleic acid binding, whereas the larger inhibitor 23d blocks the enzyme active site.

Keywords: Allosteric binding; Anacardic acid; Cyclooxygenase-2; Enzyme kinetics; Human 5-lipoxygenase.


Conflict of interest statement

Author Contributions

The manuscript was written through contributions of all authors. All authors have given approval to the final version of the manuscript. RW, PAMK and NE synthesized the molecules and performed the biochemical analysis. MPB and CJC performed and analyzed the docking studies and were supported by grant R01GM097082-01 from the National Institutes of Health. HJH and FJD supervised the research. RW and FJD wrote the manuscript.

Figures

Figure 1
Figure 1
Residual enzyme activity that was observed for the screening of a salicylate-based compound collection for inhibition of h-5-LOX and COX-2 activity in the presence of 50 μM of the respective compounds. The h-5-LOX activity was determined in presence of 100 μM linoleic acid as a substrate. The COX-2 activity was determined in presence of 2 mM arachidonic acid as a substrate. The results presented were the average of three independent experiments and the standard deviations are shown.
Figure 2
Figure 2
Surface tensions of (A) Anacardic acid 14 and (B) compound 23a (C) compound 23d against the logarithm of concentration. CMC values (A–C) were measured in human 5-LOX assay conditions, Tris buffer (50 mM), 2 mM EDTA and 2 mM CaCl2, pH 7.5, R.T.(t = 19°C).
Figure 2
Figure 2
Surface tensions of (A) Anacardic acid 14 and (B) compound 23a (C) compound 23d against the logarithm of concentration. CMC values (A–C) were measured in human 5-LOX assay conditions, Tris buffer (50 mM), 2 mM EDTA and 2 mM CaCl2, pH 7.5, R.T.(t = 19°C).
Figure 2
Figure 2
Surface tensions of (A) Anacardic acid 14 and (B) compound 23a (C) compound 23d against the logarithm of concentration. CMC values (A–C) were measured in human 5-LOX assay conditions, Tris buffer (50 mM), 2 mM EDTA and 2 mM CaCl2, pH 7.5, R.T.(t = 19°C).
Figure 3
Figure 3
Concentration dependent activation of the linoleic acid conversion by h-5-LOX in the presence of various concentrations of compound 23a and in its absence (control). The results were the average of three independent experiments with error bars (±S.D)
Figure 4
Figure 4
Steady-state kinetic characterization of the linoleic acid conversion versus the ATP concentration of h-5-LOX activator 23a. (a) the Michaelis-Menten plots and (b) the Lineweaver-Burk plots show the relation of h-5-LOX activity versus the ATP concentration at three selected concentration of 23a (■) 0 μM, (●) 12.5 μM, and (▲) 25 μM in the presence of 100 μM linoleic acid substrate.
Figure 4
Figure 4
Steady-state kinetic characterization of the linoleic acid conversion versus the ATP concentration of h-5-LOX activator 23a. (a) the Michaelis-Menten plots and (b) the Lineweaver-Burk plots show the relation of h-5-LOX activity versus the ATP concentration at three selected concentration of 23a (■) 0 μM, (●) 12.5 μM, and (▲) 25 μM in the presence of 100 μM linoleic acid substrate.
Figure 5
Figure 5
Steady-state kinetic characterization of the linoleic acid conversion by h-5-LOX activation by activator 23a. (a) Michaelis-Menten plots and (b) Lineweaver-Burk plots show the relation of h-5-LOX activity versus linoleic acid concentrations at three selected concentrations of 23a (■) 0 μM, (●) 12.5 μM, and (▲) 25 μM.
Figure 5
Figure 5
Steady-state kinetic characterization of the linoleic acid conversion by h-5-LOX activation by activator 23a. (a) Michaelis-Menten plots and (b) Lineweaver-Burk plots show the relation of h-5-LOX activity versus linoleic acid concentrations at three selected concentrations of 23a (■) 0 μM, (●) 12.5 μM, and (▲) 25 μM.
Figure 6
Figure 6
Re-plot of 1/Δslopes and 1/Δy-intercept versus concentration of 23a.
Figure 7
Figure 7
Equation 1 for the enzyme kinetics according to the model in Scheme 2.44 v is the reaction velocity, Vmax is the maximal reaction velocity, [S] is the substrate concentration and Km is the Michaelis-Menten constant, [A] is the activator concentration. α and β, respectively, are the parameters to describe the change in the affinity of substrate binding and the change in the catalytic constant.
Figure 8
Figure 8
Steady-state kinetic characterization of linoleic acid conversion by h-5-LOX by inhibitor 23d. (a) Michaelis-Menten plots and (b) Lineweaver-Burk plots show the relation of h-5-LOX activity versus linoleic acid concentration at three selected concentrations of 23d (■) 0 μM, (●) 25 μM, and (▲) 50 μM.
Figure 8
Figure 8
Steady-state kinetic characterization of linoleic acid conversion by h-5-LOX by inhibitor 23d. (a) Michaelis-Menten plots and (b) Lineweaver-Burk plots show the relation of h-5-LOX activity versus linoleic acid concentration at three selected concentrations of 23d (■) 0 μM, (●) 25 μM, and (▲) 50 μM.
Figure 9
Figure 9
Equation 2 (a), Equation 3 (b) and equation 4 (c) for the enzyme kinetics according to the model in Scheme 2. v is the reaction velocity, Vmax is the maximal reaction velocity, [S] is the substrate concentration and Km is the Michaelis-Menten constant. α and α′, respectively, are the parameters to describe the change of substrate binding affinity to the enzyme and the change of the maximum velocities. Ki is the dissociation constant of the inhibitor to the free enzyme and Ki′ is the dissociation constant of the inhibitor to the enzyme-substrate complex.
Figure 10
Figure 10
Residual enzyme activity that was observed for compounds 23a and 23d for inhibition of h-5-LOX in the presence of 50 μM of the respective compounds with linoleic acid or arachidonic acid as a substrate both at final concentrations of 100 μM. The results presented were the average of three independent experiments and the standard deviations are shown.
Figure 11
Figure 11. Docking models of Compounds 23 a,b,c,d in a model of linoleic acid bound to h-5-LOX
(a) Model of bound linoleic acid (yellow) based on a superposition to the configuration of arachidonic acid in the crystal structure (blue). Front (b) and back (c) view of the highest ranking binding mode of compound 23a (green) and compound 23d (orange) in the linoleic acid bound active site (a). Yellow dashed lines indicate the hydrogen bond between the ether oxygen and the backbone nitrogen of Phe177. Black dashed lines indicate hydrophobic interactions. (d) Superposition of highest ranked docked configurations of compounds 23a (green), 23b (purple), 23c (dark blue), 23d (orange) show that larger carbon tails block larger portions of the entrance to the catalytic site. Linoleic acid (yellow) and arachidonic acid (blue) are also shown as references.
Scheme 1
Scheme 1
Reagents and conditions: a) SOCl2, DMAP, DME, Acetone, 0 °C for 1 h, then R.T. overnight; b) 1-bromo alkane, K2CO3, DMF, R.T. overnight; c) NaBH4, MeOH, 0 °C for 1 h, then R.T. for 30 min; d) PBr3, CH2Cl2, 0 °C for 1.5 h; e) 1-bromononane, K2CO3, DMF, R.T. overnight; f) compound 1, K2CO3, DMF, R.T. overnight; g) 5 M KOH, THF, 60 °C overnight.
Scheme 2
Scheme 2
Reagents and conditions: a) Decanoylchloride, AlCl3, CH2Cl2, 60 °C for 1 h; b) NH2NH2.H2O, KOH, 1-octanol, reflux, 3h; c) Trimethylsilyl-acetylene, CuI, PdCl2(PPh3)2, Et2NH, PPh3, CH3CN, (MW, 120 °C, 95 W, 35 min), d) TBAF, THF, 0 °C, 10 min; e) CuI, PdCl2(PPh3)2, Et2NH, triflate 10, CH3CN (MW, 120 °C, 70 W, 35 min); f) H2, Pd/C, MeOH, 45 °C, 24 h; g) 2-aminophenol, polyphosphatic acid, 180 °C for 6.5 h.
Scheme 3
Scheme 3
Kinetic model for non-essential activation.
Scheme 4
Scheme 4
Kinetic model for mixed type enzyme inhibition.

Similar articles

Cited by

References

    1. Martel-Pelletier J, Lajeunesse D, Reboul P, Pelletier J. Ann Rheum Dis. 2003;62:501. - PMC - PubMed
    1. Gillmor SA, Villasenor A, Fletterick R, Sigal E, Browner MF. Nat Struct Biol. 1997;4:1003. - PubMed
    1. Sigal E. Am J Physiol. 1991;260:L13. - PubMed
    1. Epp N, Fürstenberger G, Müller K, de Juanes S, Leitges M, Hausser I, Thieme F, Liebisch G, Schmitz G, Krieg P. J Cell Biol. 2007;177:173. - PMC - PubMed
    1. Ikei KN, Yeung J, Apopa PL, Ceja J, Vesci J, Holman TR, Holinstat M. J Lipid Res. 2012;53:2546. - PMC - PubMed

Publication types

MeSH terms