. 2013 Nov 14;4(11):e919.
doi: 10.1038/cddis.2013.447.

(ADP-ribose) polymerase 1 and AMP-activated protein kinase mediate progressive dopaminergic neuronal degeneration in a mouse model of Parkinson's disease

Affiliations

(ADP-ribose) polymerase 1 and AMP-activated protein kinase mediate progressive dopaminergic neuronal degeneration in a mouse model of Parkinson's disease

T W Kim et al. Cell Death Dis. .

Abstract

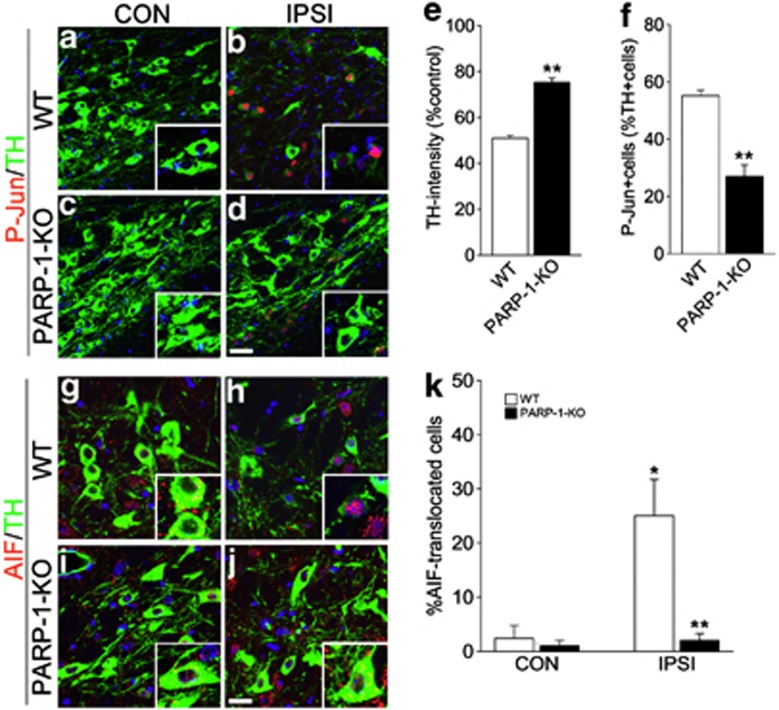
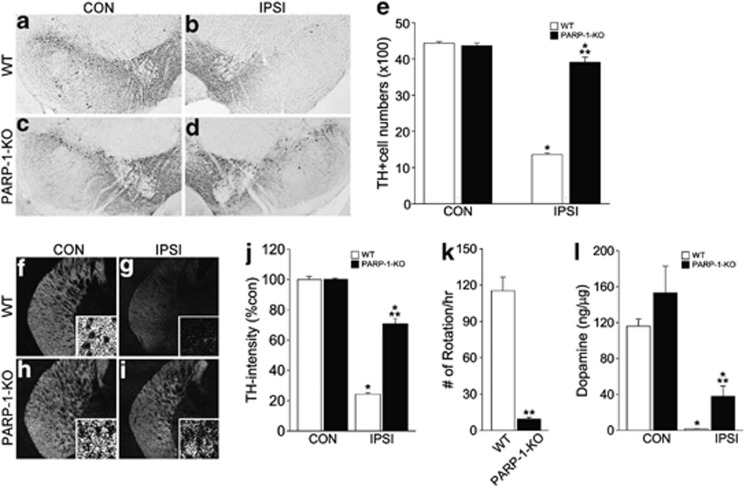
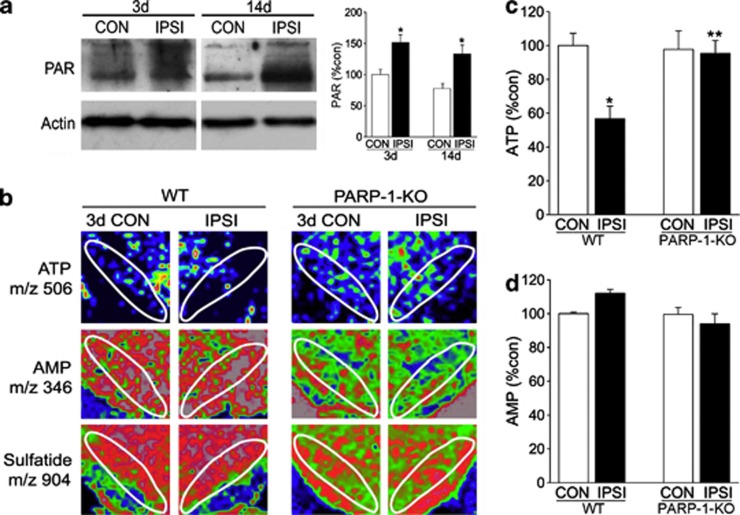
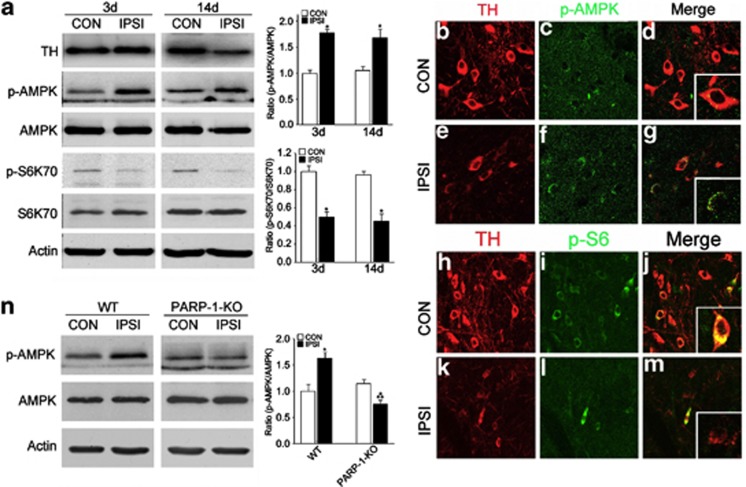
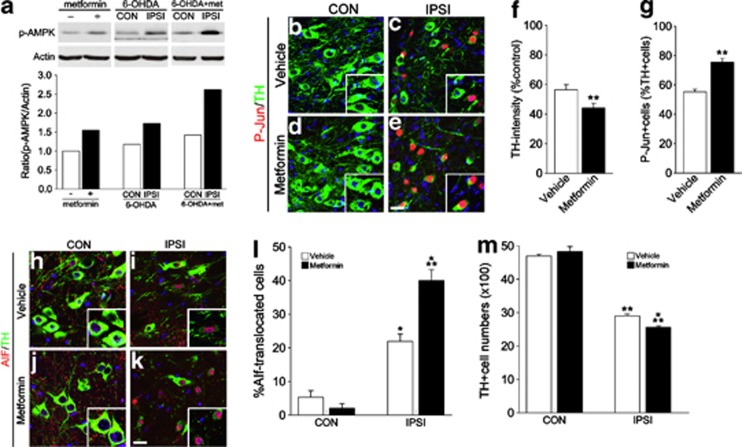
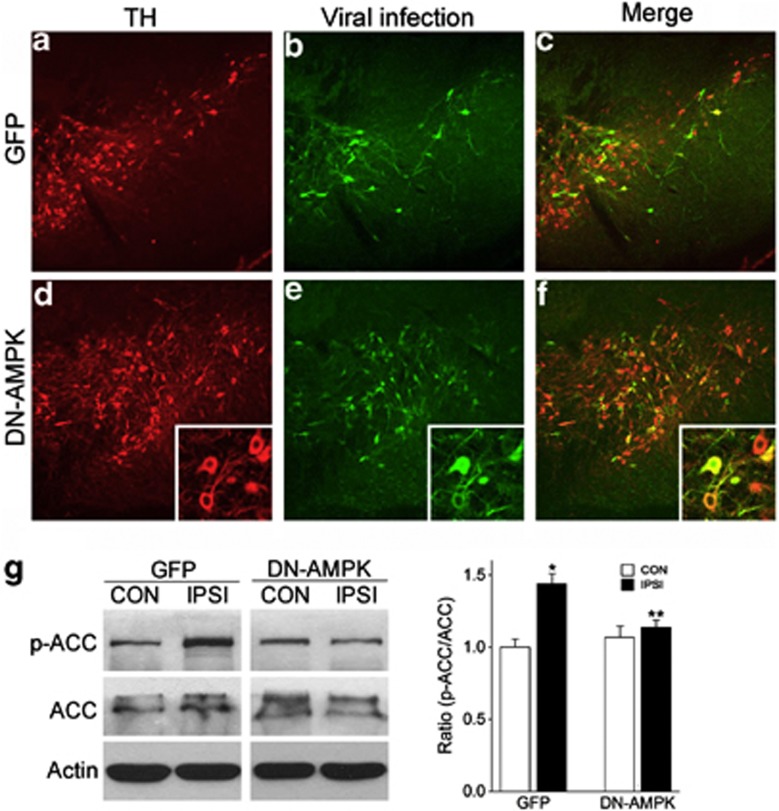
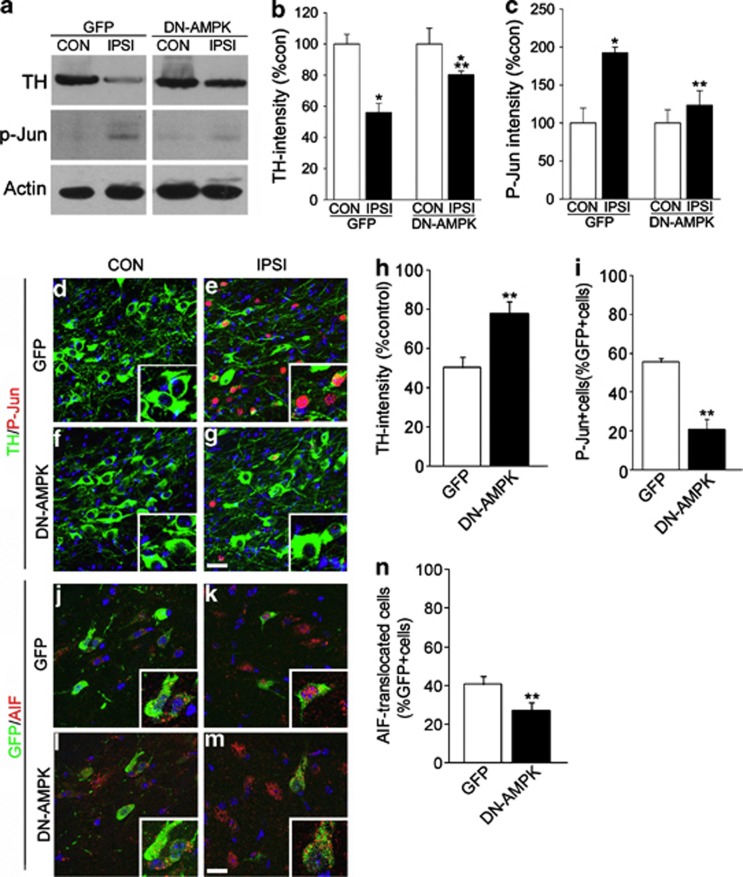
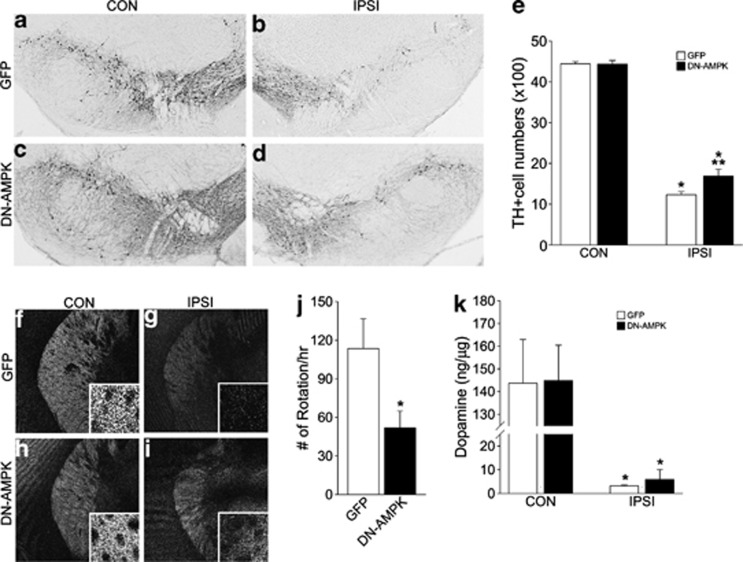
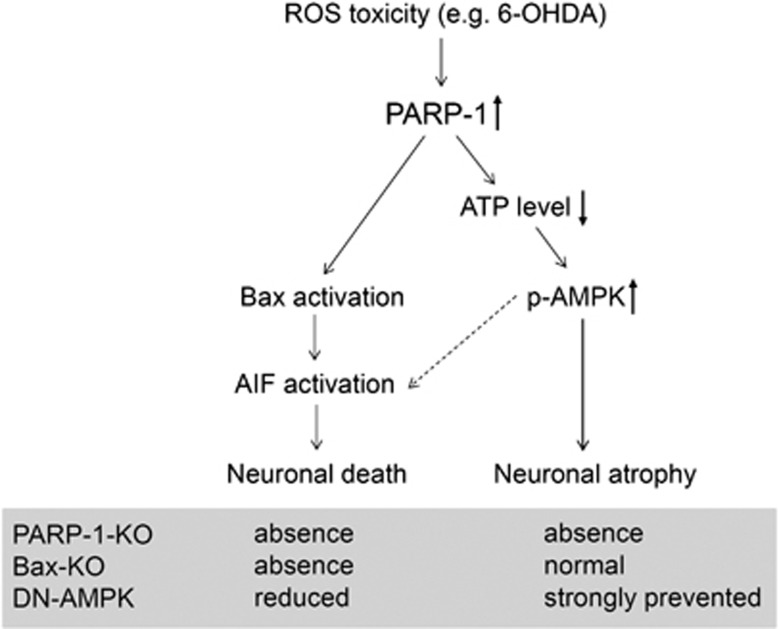
Genetic and epidemiologic evidence suggests that cellular energy homeostasis is critically associated with Parkinson's disease (PD) pathogenesis. Here we demonstrated that genetic deletion of Poly (ADP-ribose) polymerase 1 completely blocked 6-hydroxydopamine-induced dopaminergic neurodegeneration and related PD-like symptoms. Hyperactivation of PARP-1 depleted ATP pools in dopaminergic (DA) neurons, thereby activating AMP-activated protein kinase (AMPK). Further, blockade of AMPK activation by viral infection with dominant-negative AMPK strongly inhibited DA neuronal atrophy with moderate suppression of nuclear translocation of apoptosis-inhibiting factor (AIF), whereas overactivation of AMPK conversely strengthened the 6-OHDA-induced DA neuronal degeneration. Collectively, these results suggest that manipulation of PARP-1 and AMPK signaling is an effective therapeutic approach to prevent PD-related DA neurodegeneration.


Figures

Figure 1
Figure 1
6-OHDA-induced DA neuronal degeneration in WT and PARP-1-KO mice. (a-d) Two weeks after striatal 6-OHDA injection to WT (a, b) or PARP-1-KO (c, d) mice, coronal brain sections containing contralateral (CON; a, c) or ipsilateral (IPSI; b, d) substantia nigra (SN) were immunolabeled with tyrosine hydroxylase (TH) in green and P-Jun in red. Nuclei were counterstained with Hoechst33342 in blue. Insets show magnified images. Scale bar=20 μm. (e) Quantification of TH immunoreactivities in the SN of WT and PARP-1-KO mice 2 weeks after 6-OHDA injection. Data are expressed as the percentage mean±S.E.M. compared with the mean value of TH intensity of the CON side in each animal, n=4. (f) Percentage of P-Jun-expressing cells among TH+ cells in the IPSI side SN of WT and PARP-1-KO mice. Data are expressed as the percentage mean±S.E.M., n=4. (gj) Double labeling of TH and AIF in CON (g, i) and IPSI (h, j) sides of WT (g, h) and PARP-1-KO (i, j) mice. Nuclei were counterstained with Hoechst33342 in blue. Insets show large magnification images. (k) Percentage of TH+ cells exhibiting nuclear AIF signals. Data are expressed as the percentage mean±S.E.M., n=4. *P<0.05, Student's t-test comparison with CON versus IPSI sides. **P<0.05, Student's t-test comparison with WT versus PARP-1-KO mice
Figure 2
Figure 2
PARP-1-KO mice maintain DA neuronal integrity following 6-OHDA injection. (ad) TH labeling of CON (a, c) and IPSI (b, d) SN of WT (a, b) and PARP-1-KO (c, d) mice 6 weeks after 6-OHDA injection. (e) Quantification of the TH-expressing DA neurons in the CON and IPSI sides of SN in WT and PARP-1-KO mice. Data are expressed as the percentage mean±S.E.M. compared with the mean value of TH intensity of the CON side in each animal, n=4. *P<0.05, Student's t-test comparison with CON versus IPSI sides. **P<0.05, Student's t test comparison with WT versus PARP-1-KO mice. (fi) Distribution of TH immunoreactive fibers in the CON (f, h) and IPSI (g, i) sides of WT (f, g) and PARP-1-KO (h, i) mice. (j) Quantification of TH-immunoreactive intensity in the IPSI striatum. Data are expressed as the percentage mean±S.E.M. compared with the mean value of TH intensity of CON side in each animal, n=4. (k) Number of rotations per hour following apomorphine treatments, n=6 for WT and n=7 for PARP-1-KO mice. (l) Level of dopamine in the WT and PARP-1-KO striatum, n=4
Figure 3
Figure 3
PARP activation and ATP levels in the WT and PARP-1-KO SN following 6-OHDA treatments. (a) Immunoblots of PAR (poly-ADP-ribosylation) in the CON and IPSI sides of SN 3 or 14 days after 6-OHDA injection. Graph shows relative PAR polymer optical densities. N=3 (b) ATP and metabolite changes monitored by IMS. At 3 days after 6-OHDA treatment, the midbrain of WT and PARP-1-KO mice was processed, and the contents of ATP (1st) and AMP (2nd) were visualized as pseudocolors. Sulfatide, membrane-rich phospholipids were visualized as a control (last column). (c, d) Quantification of ATP (c), AMP (d), in the CON and IPSI WT and PARP-1-KO SN 3 days after 6-OHDA treatment. SN area was indicated by white line, and the relative intensity of the signals in the SN was obtained using ImageJ software (NIH, Bethesda, MD, USA), n=4. *P<0.05, Student's t-test comparison with CON versus IPSI sides. **P<0.05, Student's t-test comparison with WT versus PARP-1-KO mice
Figure 4
Figure 4
AMPK activation in degenerating DA neurons. (a) At 3 and 14 days after 6-OHDA treatment, SNs from CON and IPSI sides were micropunched, and the expression levels of TH, p-AMPK, AMPK, pS6K70, S6K70, and actin were assessed, n=3. The graphs represent the ratios of band densities (p-AMPK/AMPK and ps6K70/S6K70). (bg) TH (b, e) and p-AMPK (c, f) were double labeled in the CON (bd) and IPSI (eg) SN 14 days after 6-OHDA injection. Merged images are shown in (d, g). Insets show the magnified images. (hm) TH (h, k) and p-S6 (i, l) were double labeled in the CON (hj) and IPSI (km) SN 14 days after 6-OHDA injection. (n) Expressions of p-AMPK, AMPK, and actin in WT and PARP-1-KO CON and IPSI SN 3 days after 6-OHDA injection, n=3. The graph represents the ratios of band densities (p-AMPK/AMPK)
Figure 5
Figure 5
Acceleration of DA neuronal degeneration by metformin (a) Immunoblots of p-AMPK, actin in the brain lysates (SN) after receiving metformin in drinking water for 3 days, 3 days after 6-OHDA injection with metformin, or 3 days after 6-OHDA injection without metformin. Graphs at the bottom show relative p-AMPK optical densities. (be) Two weeks after striatal 6-OHDA injection to vehicle- (b, c) or metformin-treated (d, e) mice, coronal brain sections containing contralateral (CON; b, d) or ipsilateral (IPSI; c, e) sides of SN were immunolabeled with TH and P-Jun. Nuclei were counterstained with Hoechst33342. Insets show large magnification images. Scale bar=20 μm. (f): Quantification of the intensities of TH immunoreactivity in the SN of vehicle- and metformin-treated mice 2 weeks after 6-OHDA injection. Data are expressed as the percentage mean±S.E.M. compared with the mean value of TH intensity of CON side in each animal. n=4. (g) Percentage of P-Jun-expressing cells among TH-positive cells in the IPSI side SN of vehicle- and metformin-treated mice. Data are expressed as the percentage mean±S.E.M. n=4. (hk): Double labeling of TH and AIF in CON (h, j) or IPSI (i, k) sides of vehicle- (h, i) or metformin-treated (j, k) mice. Nuclei were counterstained with Hoechst33342. Insets show large magnification images. (l) Percentage of TH-positive cells exhibiting nuclear AIF signals. (m) Quantification of the TH-expressing DA neurons in the CON and IPSI sides of SN in vehicle- and metformin-treated mice. Data are expressed as the percentage mean±S.E.M., n=5. *P<0.05 in Student's t-test comparison with CON versus IPSI sides. **P<0.05 in Student's t-test comparison with vehicle- versus metformin-treated mice
Figure 6
Figure 6
Retrograde labeling and inhibition of AMPK activation in DA neurons by DN-AMPK adenovirus. (af) Images taken 2 weeks after injection of GFP (ac) or DN-AMPK (df) virus to adult mouse striatum. TH (a, d) and GFP (b, e) were double labeled in the SN 14 days after virus injection. Merged images are shown in (c, f). Insets in (df) show magnified images of infected DA neurons. (g) Expressions of p-ACC, ACC, and actin in SN 17 days after GFP or DN-AMPK virus injection. The graph represents the ratio of band densities (p-ACC/ACC) from western blotting experiments, n=3
Figure 7
Figure 7
Inhibition of DA neuronal degeneration by DN-AMPK. (a) Immunoblots of TH, P-Jun, and actin in the CON and IPSI sides of GFP or DN-AMPK virus-injected SN 2 weeks after striatal 6-OHDA injection. (b, c) Quantification of the relative optical densities of TH (b) and p-Jun (c). n=3; *P<0.05, Student's t-test comparison with CON versus IPSI; **P<0.05, Student's t-test comparison with GFP versus DN-AMPK virus-injected mice. (dg) TH (green) and P-Jun (red) immunolabeling in the CON (d, f) and IPSI (e, g) sides of the SN 2 weeks after 6-OHDA injection with GFP (d, e) or DN-AMPK (f, g) virus. (hi) Quantification of TH intensity (h) and P-Jun+ cells (i) among GFP-labeled cells. Data are expressed as the percentage mean±S.E.M., n=4. *P<0.05, Student's t-test comparison. (jm) Double labeling of GFP and AIF in CON (j, l) and IPSI (k, m) sides of GFP (j, k) and DN-AMPK (l, m) virus-injected mice. Nuclei were counterstained with Hoechst33342 in blue. Insets show magnified images. (n) Percentage of TH+ cells exhibiting nuclear AIF signals. Data are expressed as the percentage mean±S.E.M., n=4. *P<0.05, Student's t-test comparison
Figure 8
Figure 8
Long-term effect of DN-AMPK on DA neuronal degeneration. (ad) TH labeling of CON (a, c) and IPSI (b, d) SN of GFP (a, b) and DN-AMPK virus-injected mice (c, d) 6 weeks after 6-OHDA injection. (e) Quantification of TH-expressing DA neurons in the CON and IPSI sides of SN in GFP and DN-AMPK virus-injected mice. Data are expressed as %mean±S.E.M compared with the mean value of TH intensity of the CON side in the same animal, n=4. *P<0.05, Student's t-test comparison with CON versus IPSI sides; **P<0.05, Student's t-test comparison with GFP versus DN-AMPK mice. (fi) Distribution of TH immunoreactive fibers in the CON (f, h) and IPSI (g, i) sides of GFP (f, g) and DN-AMPK virus-injected mice (h, i). (j) Number of rotations per hour following apomorphine treatments, n=6 for GFP and n=7 for DN-AMPK mice. *P<0.05, Student's t-test comparison with CON versus IPSI sides. (k) Striatal DA levels in GFP and DN-AMPK virus-injected mice, n=5
Figure 9
Figure 9
Schematic diagram for the proposed signaling pathways of 6-OHDA-induced DA neurodegeneration. ROS toxicity induced by 6-OHDA treatments promotes the hyperactivation of PARP-1 in the DA neurons, which in turn promotes a rapid depletion of ATP and mitochondrial Bax translocation. Reduced cellular ATP level triggers AMPK activation, and activated AMPK initiates neuronal atrophy. In addition, AMPK activation appears to affect the nuclear translocation of AIF and subsequent DA neuronal death. Therefore, blockade of PARP-1 activity completely prevents DA neuronal atrophy and death, whereas Bax knockout only prevents neuronal death. In contrast, suppression of AMPK strongly inhibits neuronal atrophy but partly reduces AIF-dependent neuronal death

References

    1. Dawson TM. New animal models for Parkinson's disease. Cell. 2000;101:115–118. - PubMed
    1. Turmel H, Hartmann A, Parain K, Douhou A, Srinivasan A, Agid Y, et al. Caspase-3 activation in 1-methyl-4-phenyl-1,2,3,6-tetrahydropyridine (MPTP)-treated mice. Mov Disord. 2001;16:185–189. - PubMed
    1. Mladenovic A, Perovic M, Raicevic N, Kanazir S, Rakic L, Ruzdijic S. 6-Hydroxydopamine increases the level of TNFalpha and bax mRNA in the striatum and induces apoptosis of dopaminergic neurons in hemiparkinsonian rats. Brain Res. 2004;996:237–245. - PubMed
    1. Yang L, Calingasan NY, Wille EJ, Cormier K, Smith K, Ferrante RJ, et al. Combination therapy with coenzyme Q10 and creatine produces additive neuroprotective effects in models of Parkinson's and Huntington's diseases. J Neurochem. 2009;109:1427–1439. - PMC - PubMed
    1. Ferreira IL, Resende R, Ferreiro E, Rego AC, Pereira CF. Multiple defects in energy metabolism in Alzheimer's disease. Curr Drug Targets. 2010;11:1193–1206. - PubMed

Publication types