

Spectral asymmetry and Higuchi's fractal dimension measures of depression electroencephalogram
- PMID: 24232245
- PMCID: PMC3819823
- DOI: 10.1155/2013/251638
Spectral asymmetry and Higuchi's fractal dimension measures of depression electroencephalogram
Abstract
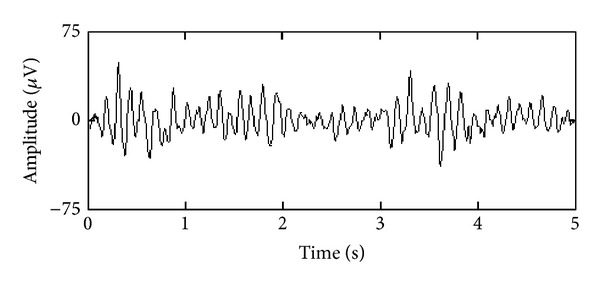
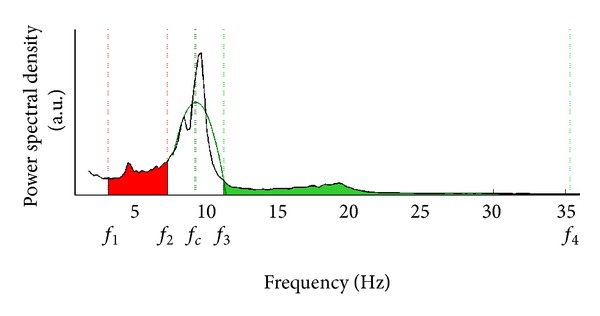
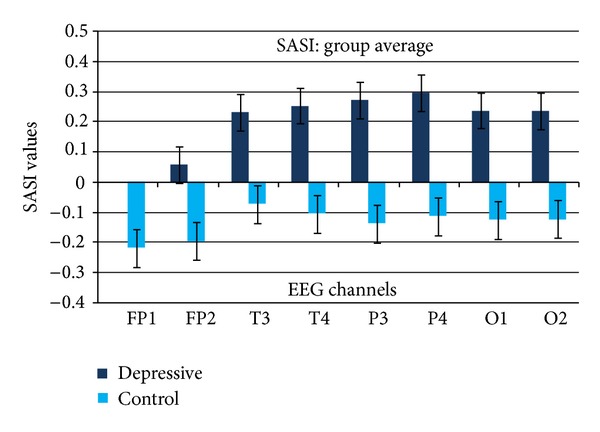
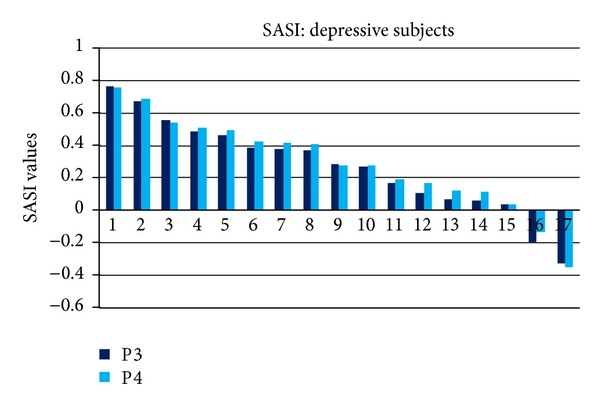
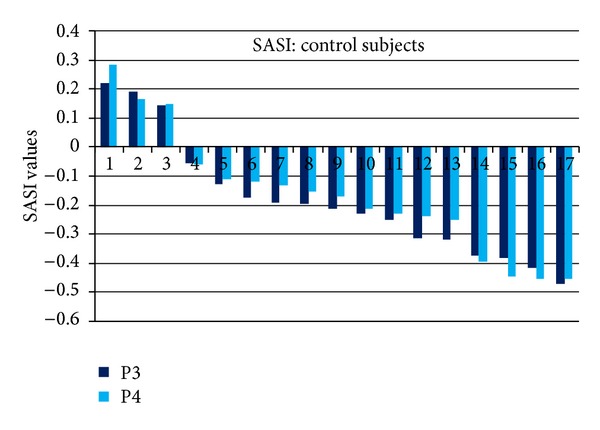
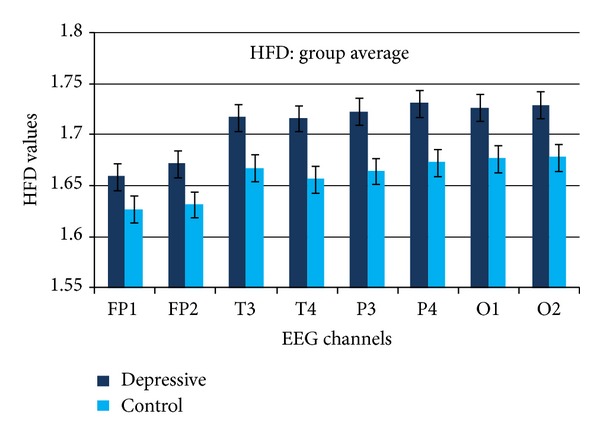
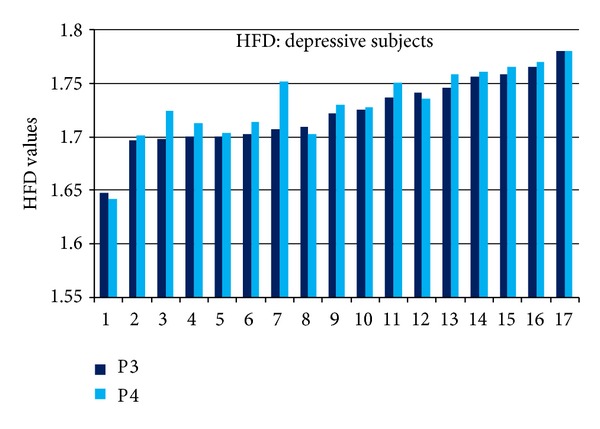
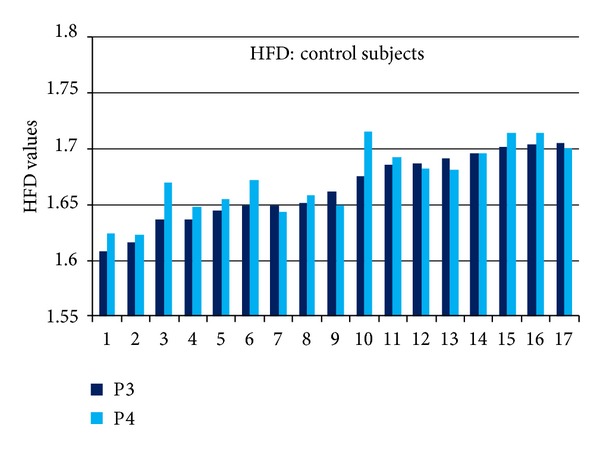
This study was aimed to compare two electroencephalogram (EEG) analysis methods, spectral asymmetry index (SASI) and Higuchi's fractal dimension (HFD), for detection of depression. Linear SASI method is based on evaluation of the balance of powers in two EEG frequency bands in one channel selected higher and lower than the alpha band spectrum maximum. Nonlinear HFD method calculates fractal dimension directly in the time domain. The resting EEG signals of 17 depressive patients and 17 control subjects were used as a database for calculations. SASI values were positive for depressive and negative for control group (P < 0.05). SASI provided the true detection rate of 88% in the depressive and 82% in the control group. The calculated HFD values detected a small (3%) increase with depression (P < 0.05). HFD provided the true detection rate of 94% in the depressive group and 76% in the control group. The rate of correct indication in the both groups was 85% using SASI or HFD. Statistically significant variations were not revealed between hemispheres (P > 0.05). The results indicated that the linear EEG analysis method SASI and the nonlinear HFD method both demonstrated a good sensitivity for detection of characteristic features of depression in a single-channel EEG.
Figures
References
-
- National Institute of Mental Health, Any Disorder Among Adults. http://www.nimh.nih.gov/statistics/1ANYDIS_ADULT.shtml.
-
- National Institute of Mental Health, Major Depressive Disorder Among Adults. http://www.nimh.nih.gov/statistics/1MDD_ADULT.shtml.
-
- Roberts JA, Robinson PA. Quantitative theory of driven nonlinear brain dynamics. Neuroimage. 2012;62(3):1947–1955. - PubMed
-
- Stam CJ. Nonlinear dynamical analysis of EEG and MEG: review of an emerging field. Clinical Neurophysiology. 2005;116(10):2266–2301. - PubMed
Publication types
MeSH terms
LinkOut - more resources
Full Text Sources
Other Literature Sources
Medical
