. 2014 Feb;42(4):2646-59.
doi: 10.1093/nar/gkt1139. Epub 2013 Nov 14.

Translation rate is controlled by coupled trade-offs between site accessibility, selective RNA unfolding and sliding at upstream standby sites

Affiliations

Translation rate is controlled by coupled trade-offs between site accessibility, selective RNA unfolding and sliding at upstream standby sites

Amin Espah Borujeni et al. Nucleic Acids Res. 2014 Feb.

Abstract

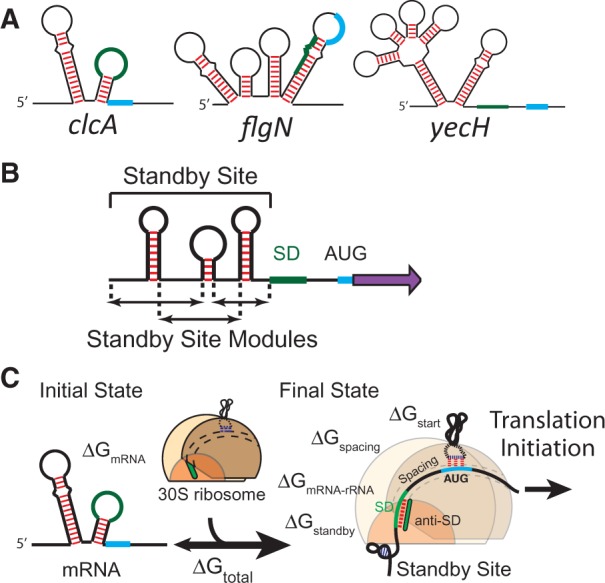
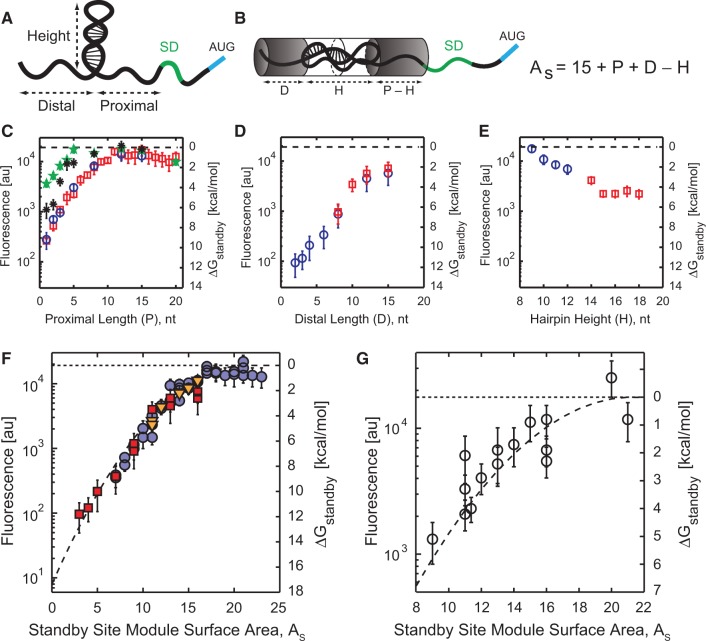
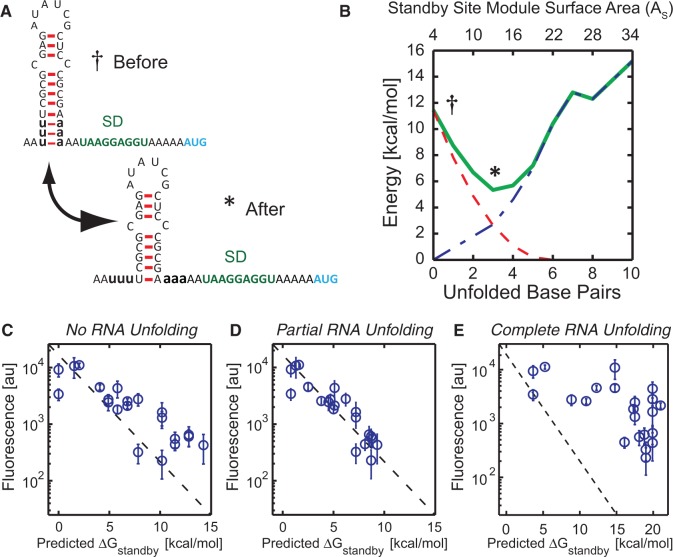
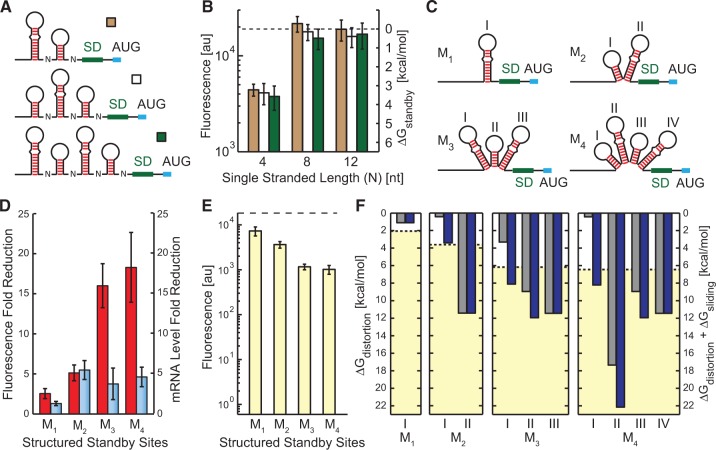
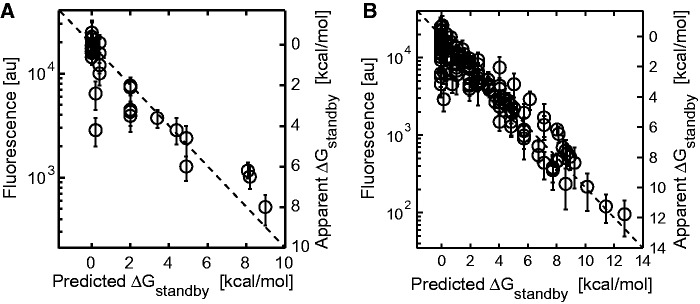
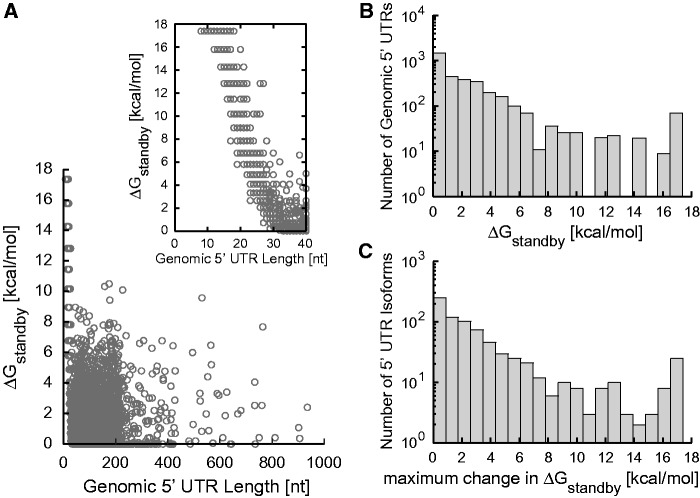
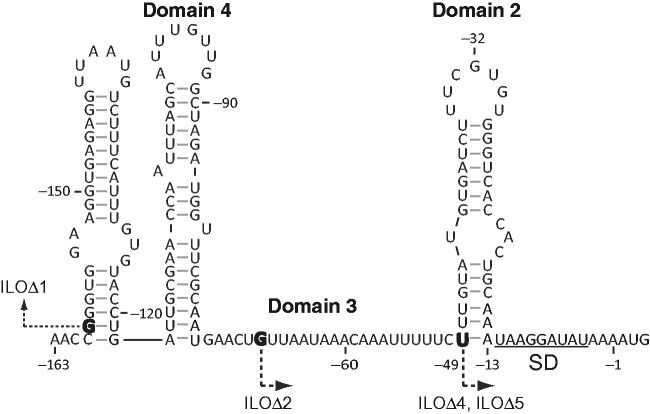
The ribosome's interactions with mRNA govern its translation rate and the effects of post-transcriptional regulation. Long, structured 5' untranslated regions (5' UTRs) are commonly found in bacterial mRNAs, though the physical mechanisms that determine how the ribosome binds these upstream regions remain poorly defined. Here, we systematically investigate the ribosome's interactions with structured standby sites, upstream of Shine-Dalgarno sequences, and show that these interactions can modulate translation initiation rates by over 100-fold. We find that an mRNA's translation initiation rate is controlled by the amount of single-stranded surface area, the partial unfolding of RNA structures to minimize the ribosome's binding free energy penalty, the absence of cooperative binding and the potential for ribosomal sliding. We develop a biophysical model employing thermodynamic first principles and a four-parameter free energy model to accurately predict the ribosome's translation initiation rates for 136 synthetic 5' UTRs with large structures, diverse shapes and multiple standby site modules. The model predicts and experiments confirm that the ribosome can readily bind distant standby site modules that support high translation rates, providing a physical mechanism for observed context effects and long-range post-transcriptional regulation.


Figures

Figure 1.
Figure 1.
(A) Natural E. coli 5′ UTRs have diverse lengths and structures with varying binding free energy penalties to the ribosomal platform. Green and light blue regions represent SD and start codon, respectively. (B) 5′ UTRs are separated into multiple standby site modules, followed by a SD sequence, spacer region and a protein coding sequence. (C) A schematic shows the mRNA regions that contact the ribosome in its initial and final states. The ribosomal platform binds to 5′ UTRs with a binding free energy penalty ΔGstandby. The sum of all binding free energies, ΔGtotal, determines how likely the ribosome binds to an mRNA and initiates translation.
Figure 2.
Figure 2.
(A) Standby site modules are defined by a proximal and distal binding site, separated by an RNA structure. (B) Standby site module surface area is calculated by summing the proximal P and distal D binding site lengths, and subtracting the hairpin height H. The surface area is kept positive by adding a constant 15. (C–E) Translation rate and ribosome binding free energy penalties are measured as proximal binding site length, distal binding site length and hairpin height are increased. The ΔGstandby numbers shown in secondary y-axis are directly related to the data according to Equation (4). (C) Hairpin heights are 9 nt (green stars), 12 nt (black asterisks), 15 nt (red squares) or 18 nt (blue circles). (D) Hairpin heights are 15 nt (red squares) or 18 nt (blue circles). (E) Hairpin height varies from 9 to 12 nt by adding to loop length of a 6 bp stem (blue circles) or from 14 to 18 nt by adding to loop length of a 12 bp stem (red squares). (F) 56 characterized 5′ UTRs (As < 24) from parts (C–E) are combined to quantitatively relate the standby site module’s surface area to the ribosome’s translation rate and binding free energy penalty. Dashed line is a best-fit quadratic equation. (G) The validity of the quadratic equation is tested by measuring translation rates from 15 additional 5′ UTRs and comparing to model predictions (R2 = 0.78, average error is 0.66 kcal/mol). Data points are the result of three measurements in 1 day. In parts (C–G), the horizontal dashed line is the translation rate and ribosome binding free energy penalty of the reference unstructured 5′ UTR.
Figure 3.
Figure 3.
(A and B) Competition between ribosomal distortion and selective RNA unfolding is illustrated on a structured 5′ UTR with a weak hairpin. The ribosome’s distortion penalty ΔGdistortion (dashed red line), hairpin unfolding penalty ΔGunfolding (dotted dashed blue line) and their sum ΔGstandby (green solid line) are shown as the hairpin’s closing base pairs are unfolded. The total binding free energy penalty has a local minima when three base pairs are unfolded. See also Supplementary Figure S4. (C–E) Scatter plots comparing measured translation rates from 22 synthetic 5′ UTRs and model predictions to test three mechanisms for the ribosome’s unfolding of RNA structures. The average difference between model predictions and measurements is (C) 2.42 kcal/mol when not unfolding structures, (D) 0.90 kcal/mol when partially unfolding structures and (E) 10.24 kcal/mol when fully unfolding structures. Comparative P-values from two-sample T-tests are 0.004 (C versus D) and 10−13 (D versus E). Data points are the result of three measurements in 1 day. In parts (C–E), the diagonal dashed line is the predicted translation rate according to Equation (2).
Figure 4.
Figure 4.
(A) Synthetic 5′ UTRs with multiple, evenly spaced standby site modules. Spacing N is varied from 4 to 12 nt. (B) Measured translation rates are compared to standby site module multiplicity, showing the absence of cooperative binding to multiple standby site modules, regardless of limiting surface areas. The ΔGstandby numbers shown in secondary y-axis are directly related to the data according to Equation (4). (C) Synthetic 5′ UTRs with one upstream and multiple internal standby site modules, labeled with roman numbers. (D) The reduction in fluorescence (red bars) and mRNA levels (blue bars) of 5′ UTRs M1 to M4, compared to an unstructured 5′ UTR (see also Supplementary Figure S2). (E) Fluorescence measurements of 5′ UTRs M1 to M4 show that upstream standby site modules can support high translation rates. (F) Model predictions are shown for 5′ UTRs M1 to M4 using either ΔGdistortion (gray bars) or ΔGdistortion + ΔGsliding (blue bars) for each standby site module (I–IV, corresponding to labels in part C), compared to the ribosome’s apparent binding free energy penalties (dashed lines, yellow region) (average error with and without the sliding penalty is 1.15 and 3.24 kcal/mol, respectively; P-value is 0.013). ΔGdistortion for each standby site module was calculated according to Equation (3). In parts B and E, the horizontal dashed line is the translation rate and ribosome binding free energy penalty of the unstructured 5′ UTR.
Figure 5.
Figure 5.
(A) A scatter plot showing fluorescence measurements and apparent ΔGstandby energy penalties compared to predicted ΔGstandby energy penalties for 28 synthetic 5′ UTRs with diverse structures (average error is 0.79 kcal/mol and R2 = 0.83). (B) The same comparison for the 136 synthetic 5′ UTRs characterized in this study (average error is 0.75 kcal/mol and R2 = 0.89). In parts (A and B), the apparent ΔGstandby numbers shown in secondary y-axis are directly related to the data according to Equation (4). An x = y diagonal line is shown (dashed).
Figure 6.
Figure 6.
(A) The ribosomal platform binding free energy penalties, ΔGstandby, for 3430 transcribed 5′ UTRs from the E. coli MG1655 genome (EcoCyc release 17.1) are compared to their lengths. The inset shows the ΔGstandby of short 5′ UTRs. (B) The number of genomic 5′ UTRs with different values of ΔGstandby is shown. (C) 5′ UTR isoforms within transcripts across the genome affect their standby site module characteristics, as quantified by the maximum calculated change in ΔGstandby.
Figure 7.
Figure 7.
The sequence and structure of E. coli thrS 5′ UTR are shown. Similar to Sacerdot et al. (45), nucleotide numbering is negative for the upstream 5′ UTR with respect to the start codon. The list of mutations is: BS4-9: G(-32)>A; BS4-9/CS29: G(-32)>A and G(-46)>A; L19: A(-13)>C, L7: U(-49)>G; CS30Δ2: deletion of domain 2 from A(-14) to U(-48); ILOΔ1: transcription begins at G(-159); ILOΔ2: transcription begins at G(-68); ILOΔ4: transcription begins at G(-49), U(-49)>G and A(-13)>C; ILOΔ5: transcription begins at G(-49), U(-49)>G and G(-46)>A. Bolded nucleotides are the positions of new transcriptional start sites.

References

    1. Tsai A, Petrov A, Marshall RA, Korlach J, Uemura S, Puglisi JD. Heterogeneous pathways and timing of factor departure during translation initiation. Nature. 2012;487:390–393. - PMC - PubMed
    1. Simonetti A, Marzi S, Jenner L, Myasnikov A, Romby P, Yusupova G, Klaholz BP, Yusupov M. A structural view of translation initiation in bacteria. Cell. Mol. Life Sci. 2009;66:423–436. - PMC - PubMed
    1. Jenner L, Romby P, Rees B, Schulze-Briese C, Springer M, Ehresmann C, Ehresmann B, Moras D, Yusupova G, Yusupov M. Translational operator of mRNA on the ribosome: how repressor proteins exclude ribosome binding. Science. 2005;308:120–123. - PubMed
    1. Beisel CL, Updegrove TB, Janson BJ, Storz G. Multiple factors dictate target selection by Hfq-binding small RNAs. EMBO J. 2012;31:1961–1974. - PMC - PubMed
    1. Storz G, Vogel J, Wassarman KM. Regulation by small RNAs in bacteria: expanding frontiers. Mol. Cell. 2011;43:880–891. - PMC - PubMed

Publication types

Substances