. 2014 Apr 1;23(7):1783-93.
doi: 10.1093/hmg/ddt569. Epub 2013 Nov 13.

Functional microRNAs and target sites are created by lineage-specific transposition

Affiliations

Functional microRNAs and target sites are created by lineage-specific transposition

Ryan M Spengler et al. Hum Mol Genet. .

Abstract

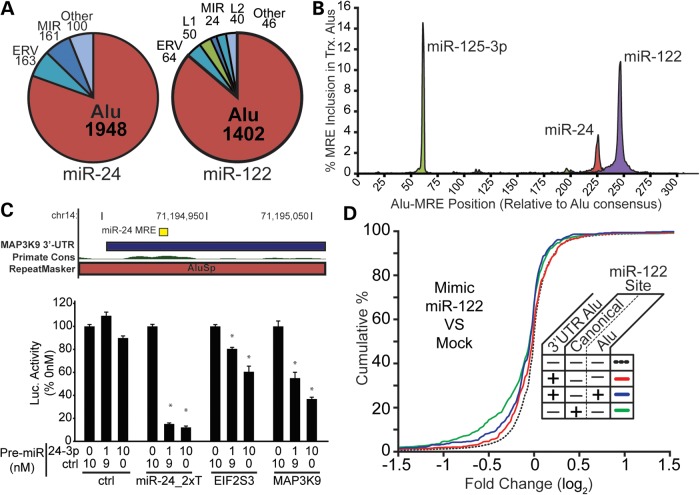
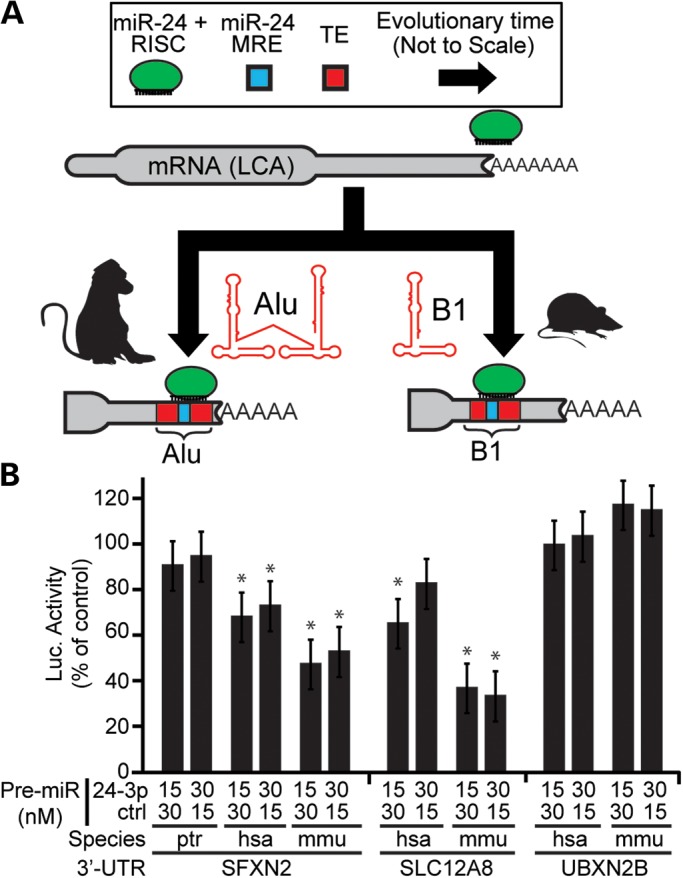
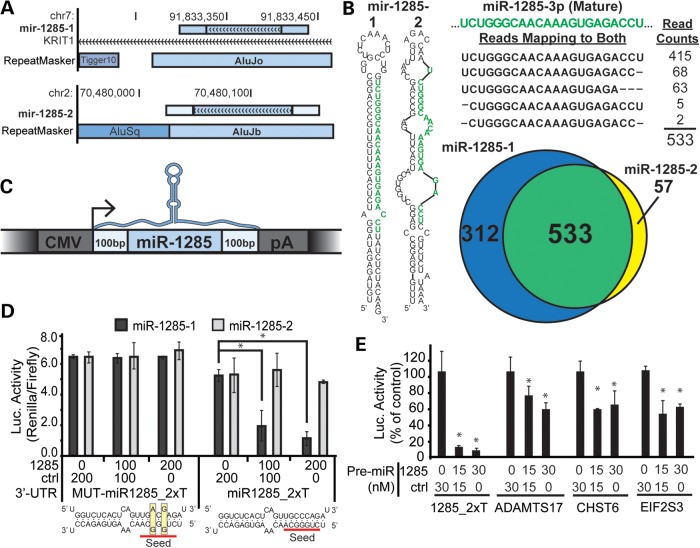
Transposable elements (TEs) account for nearly one-half of the sequence content in the human genome, and de novo germline transposition into regulatory or coding sequences of protein-coding genes can cause heritable disorders. TEs are prevalent in and around protein-coding genes, providing an opportunity to impart regulation. Computational studies reveal that microRNA (miRNA) genes and miRNA target sites reside within TE sequences, but there is little experimental evidence supporting a role for TEs in the birth of miRNAs, or as platform for gene regulation by miRNAs. In this work, we validate miRNAs and target sites derived from TE families prevalent in the human genome, including the ancient long interspersed nuclear element 2 (LINE2/L2), mammalian-wide interspersed repeat (MIR) retrotransposons and the primate-specific Alu family. We show that genes with 3' untranslated region (3' UTR) MIR elements are enriched for let-7 targets and that these sites are conserved and responsive to let-7 expression. We also demonstrate that 3' UTR-embedded Alus are a source of miR-24 and miR-122 target sites and that a subset of active genomic Alus provide for de novo target site creation. Finally, we report that although the creation of miRNA genes by Alu elements is relatively uncommon relative to their overall genomic abundance, Alu-derived miR-1285-1 is efficiently processed from its genomic locus and regulates genes with target sites contained within homologous elements. Taken together, our data provide additional evidence for TEs as a source for miRNAs and miRNA target sites, with instances of conservation through the course of mammalian evolution.


Figures

Figure 1.
Figure 1.
Genes containing 3′ UTR-embedded MIR elements are significantly enriched for conserved and high-confidence let-7a target sites. (Top Left) A pie graph summarizes the prevalence of let-7 target sites predicted in 3′ UTR-TEs. Each section displays the number of let-7 target sites tabulated after grouping TEs into the indicated families. (Top Right) The subset of 3′ UTR-resident MIRs is shown, grouped according to whether or not a let-7 target sit is predicted within the TE. The red sections of the two pie charts indicate common information, as they each depict the prevalence of MIR-derived let-7 target sites. Gene functional enrichment analysis was performed on the genes with 3′ UTR-MIRs using the ToppFun algorithm. (Bottom) Functional enrichment significance (-log10 P-value) is plotted, representing miRNAs whose targets are significantly enriched (P ≤ 0.05; Bonferroni correction) in genes with 3′ UTR-resident MIRs. Enrichment of targets predicted by Target-scan, PITA, MSigDB, PicTar and mirSVR are plotted and P-values corresponding to let-7 targets highlighted in red. For mirSVR (C = conserved, NC = non-conserved, HE = high efficacy (predicted), LE = low efficacy).
Figure 2.
Figure 2.
Assessment of conserved, MIR-derived target sites for let-7. (A) Let-7 target sites (yellow box) overlapping a MIR element (red boxes) annotated by RepeatMasker. MYO1F and E2F6 are two candidates where: (i) no let-7 site is present in the 3′ UTR aside from the MIR-derived site shown and (ii) PhyloP conservation scores (Mammal Cons track) showed sequence conservation coincident with the target site. (B) 3′ UTRs of MYCBP, MFSD4, E2F6 and MYO1F, each containing a single MIR-derived let-7 site, were cloned into dual-luciferase reporters and co-transfected into HEK293 cells with a synthetic let-7 mimic (Pre-miR™ at the doses indicated). Reactions were balanced to 1.0 nM with a non-targeting Pre-miR™ (ctrl). Luciferase activity is plotted as a percent of Renilla:Firefly ratio measured from the 0 nM let-7 (1.0 nM ctrl) treatment group. (C) HeLa cells, which express high levels of endogenous let-7a, were co-transfected with the luciferase reporters and a let-7a Anti-miR inhibitor (25, 50 nM), balanced to 50 nM with a negative control Anti-miR oligo (ctrl). Luciferase activity is presented as the Renilla:Firefly ratios measured 48 h post-transfection and normalized to the 50 nM ctrl dose of the corresponding reporter. N = 3 biological replicates with three technical replicates per assay; error bars = SD. *P ≤ 0.05 (Student's t-test; two-tailed). (D) Cumulative distribution functions are shown summarizing gene expression changes (log2 fold change) in response to let-7 over-expression (si-let-7), relative to the control siRNA (si-GFP). Transcripts were grouped according to annotations of 3′ UTR-MIRs and let-7 target sites, as indicated in the figure legends. (E) As in D, except gene expression changes were measured in response to let-7 inhibition (let-7 2′OMe) relative to a control oligo (Luc. 2′-OMe).
Figure 3.
Figure 3.
Assessment of primate-specific, Alu-derived target sites for miR-122 and miR-24, present in the Alu consensus sequence. (A). Pie charts summarizing the prevalence of the most prominent TE families are presented, with values representing the number of unique (left) miR-24 or (right) miR-122 sites tabulated. (B) RepeatMasker annotations were used to calculate miR-24, miR-122 and miR-125-3p target site positions relative to the Alu consensus sequence, tabulating target prevalence at each position. Target site frequencies are plotted, representing the fraction of all 3′ UTR Alus found with the target sequence at that position. (C) The Primate Conservation track indicates an increase in conservation score coincident with the miR-24 target overlapping the AluSp family sequence. (D) Microarray data representing gene expression changes in response to miR-122 over-expression in human cells were analyzed, and log2 expression changes relative to the miRNA control set calculated. Transcripts were grouped according the presence of 3′ UTR Alus or miR-122 sites and the cumulative distributions plotted for each group as indicated. (E) Luciferase reporters expressing EIF2S3 and MAP3K9 3′ UTRs were co-transfected into HEK293 cells with Pre-miR™ miR-24 mimics (0, 1, 10 nM Pre-miR™ doses) and luciferase activity measured 24 h later. Renilla:firefly ratios are plotted, normalizing to the ratio calculated for the corresponding 0 nM treatment set. N = 4 biological replicates with three technical replicates per transfection; error bars = SD. *P ≤ 0.05 (Student's t-test; two-tailed).
Figure 4.
Figure 4.
Convergent evolution of miR-24-mediated regulation in rodents and primates through lineage-specific TE homologs. (A) A cartoon schematic demonstrating a hypothetical example of miR-24 target sites gained independently in primate and rodent evolutionary lineages, via transposition of Alu and B1 elements, respectively. Arrows representing evolutionary time are not drawn to scale. The hypothetical mRNA of the last common ancestor (LCA) of these two lineages is drawn lacking miR-24 binding sites. (B) Luciferase reporters with miR-24 target 3′ UTRs from human (hsa), mouse (mmu) or chimpanzee (ptr) were co-transfected with miR-24 Pre-miRs at the doses indicated. Luciferase activity was calculated as the Renilla:Firefly ratios measured 24 h after transfection, normalized to the corresponding 0 nM treatment group. N = 3 biological replicates with three technical replicates per assay; error bars = SD. *P ≤ 0.05 (Student's t-test; two-tailed).
Figure 5.
Figure 5.
Alu-derived hsa-miR-1285-1 regulates homologous Alu-derived target sites. (A) Genome browser views of miR-1285-1 and miR-1285-2 loci are shown, including any overlapping transcript or RepeatMasker annotations. The miR-1285 precursor locus (light blue rectangle with arrows) is drawn to include the additional ∼200 flanking bases (light blue, no arrows). The miR-1285-1 isoform is located within an intron of the KRIT1 mRNA. (B) The most stable predicted secondary structure for human miR-1285-1 and miR-1285-2 precursors is reproduced from those provided in the miRBase repository. High-throughput sequencing reads mapping to the two loci were also taken from miRBase, and the reads mapping to the common mature miRNA sequence are shown, along with the total read counts. The mature miRNA sequence, as reported in miRBase, is highlighted in green. The Venn diagram summarizes the number of reads uniquely mapping to each locus. The area of the circles and region of overlap is drawn in proportion to the number of reads contained in each group. (C) A cartoon representation of the miR-1285 expression constructs is drawn. The coloring scheme is reproduced from Figure 5A. (D) Luciferase reporters expressing artificial 3′ UTR target sites for miR-1285 (miR1285_2xT), or a seed-mutant control (MUT-miR1285-2xT), were transfected into HEK293 cells along with the indicated doses of the miR-1285-1 (1285) and control (ctrl) expression plasmids (shown in A), and luciferase activity was measured 48 h later. Luciferase activity is represented as the measured ratio between Renilla and firefly luciferase. Predicted hybridizations between the miR-1285 mature sequence and the artificial target and mutant sites are shown below the corresponding luciferase data. (E) Luciferase reporters expressing the 3′ UTR of putative miR-1285 targets, ADAMTS17, CHST6 and EIF2S3, were co-transfected with the indicated concentrations of an artificial miR-1285 (1285) or control (ctrl) Pre-miR oligo. (CE) N = 3 biological replicates with three technical replicates per transfection; error bars = SD. *P ≤ 0.05 (ANOVA; Tukey's post hoc).

References

    1. Xing J., Witherspoon D.J., Ray D.A., Batzer M.A., Jorde L.B. Mobile DNA elements in primate and human evolution. Am J Phys Anthropol. 2007 Suppl 45, 2–19. - PubMed
    1. Lander E.S., Linton L.M., Birren B., Nusbaum C., Zody M.C., Baldwin J., Devon K., Dewar K., Doyle M., FitzHugh W., et al. Initial sequencing and analysis of the human genome. Nature. 2001;409:860–921. - PubMed
    1. Cordaux R., Batzer M.A. The impact of retrotransposons on human genome evolution. Nat. Rev. Genet. 2009;10:691–703. - PMC - PubMed
    1. Rubin C.M., VandeVoort C.A., Teplitz R.L., Schmid C.W. Alu repeated DNAs are differentially methylated in primate germ cells. Nucleic Acids Res. 1994;22:5121–5127. - PMC - PubMed
    1. Estécio M.R., Gallegos J., Dekmezian M., Lu Y., Liang S., Issa J.P. SINE retrotransposons cause epigenetic reprogramming of adjacent gene promoters. Mol. Cancer Res. 2012;10:1332–1342. - PMC - PubMed

Publication types