. 2014 Jan 3;289(1):365-78.
doi: 10.1074/jbc.M113.506733. Epub 2013 Nov 14.

Nuclear recruitment of neuronal nitric-oxide synthase by α-syntrophin is crucial for the induction of mitochondrial biogenesis

Affiliations

Nuclear recruitment of neuronal nitric-oxide synthase by α-syntrophin is crucial for the induction of mitochondrial biogenesis

Katia Aquilano et al. J Biol Chem. .

Abstract

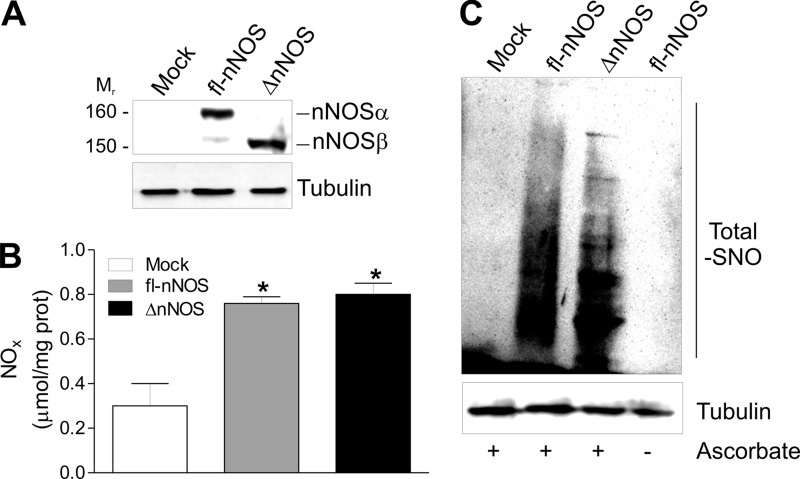
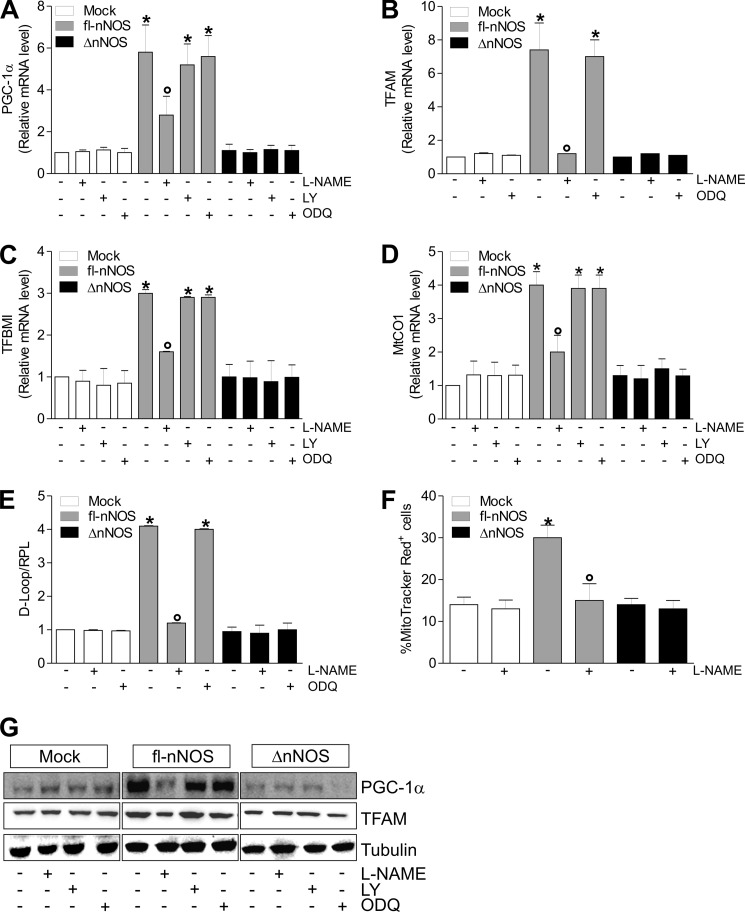
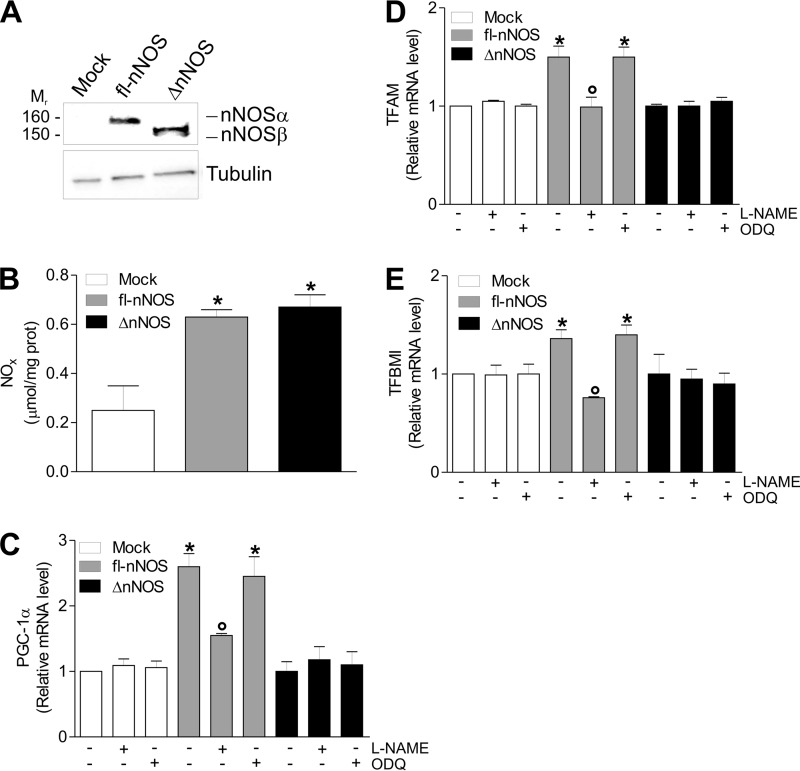
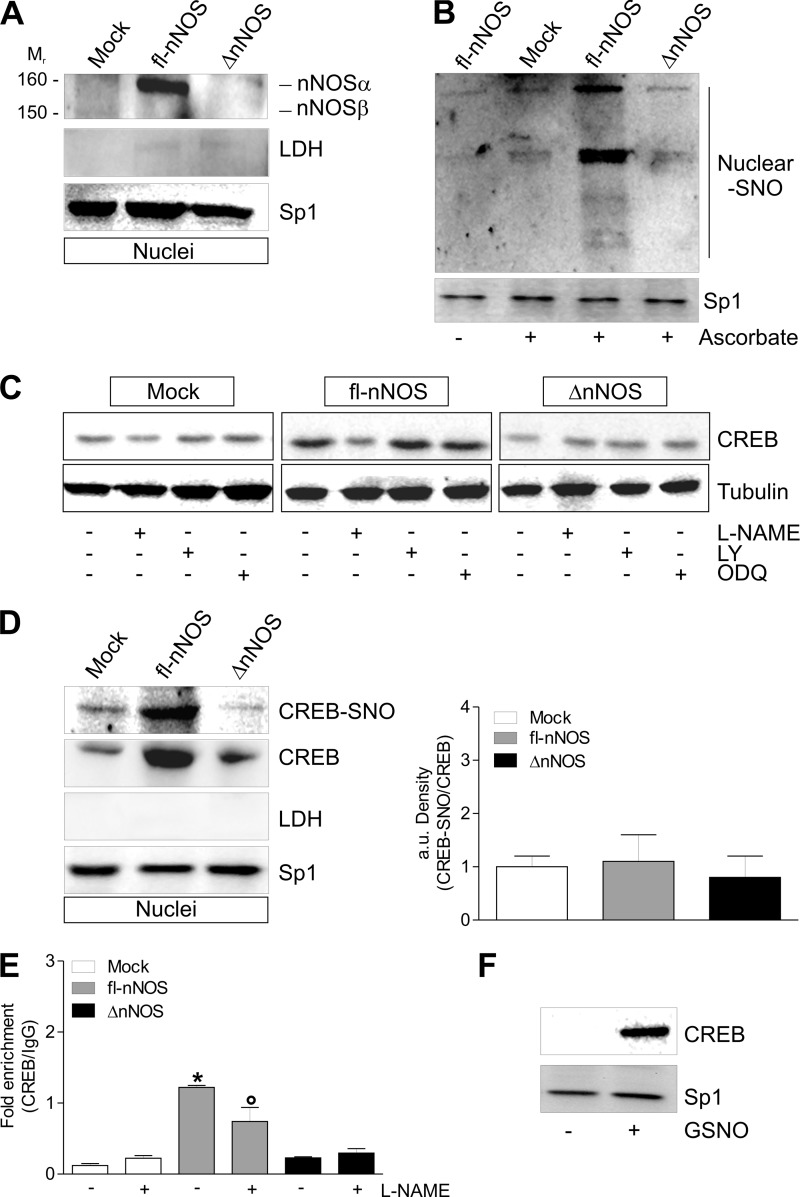
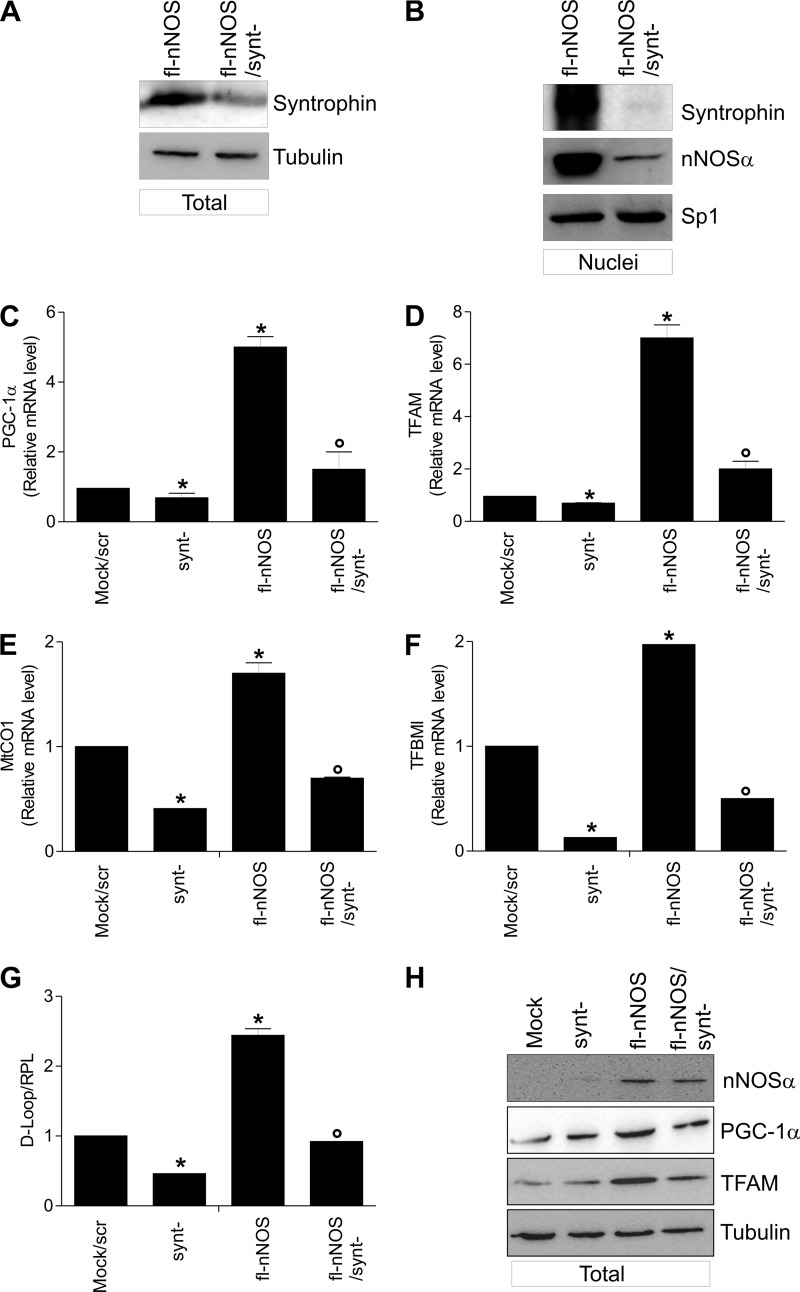
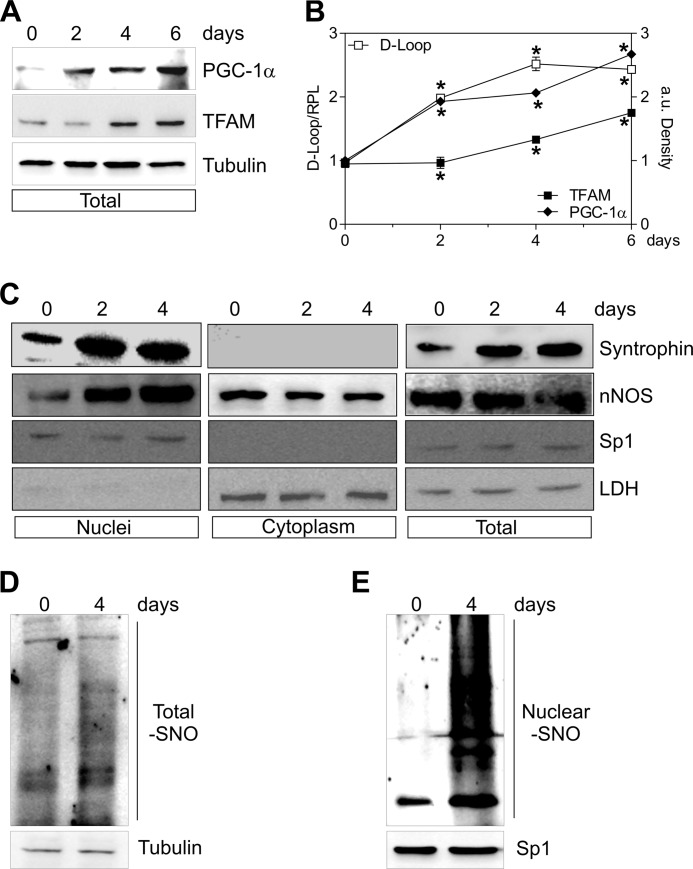
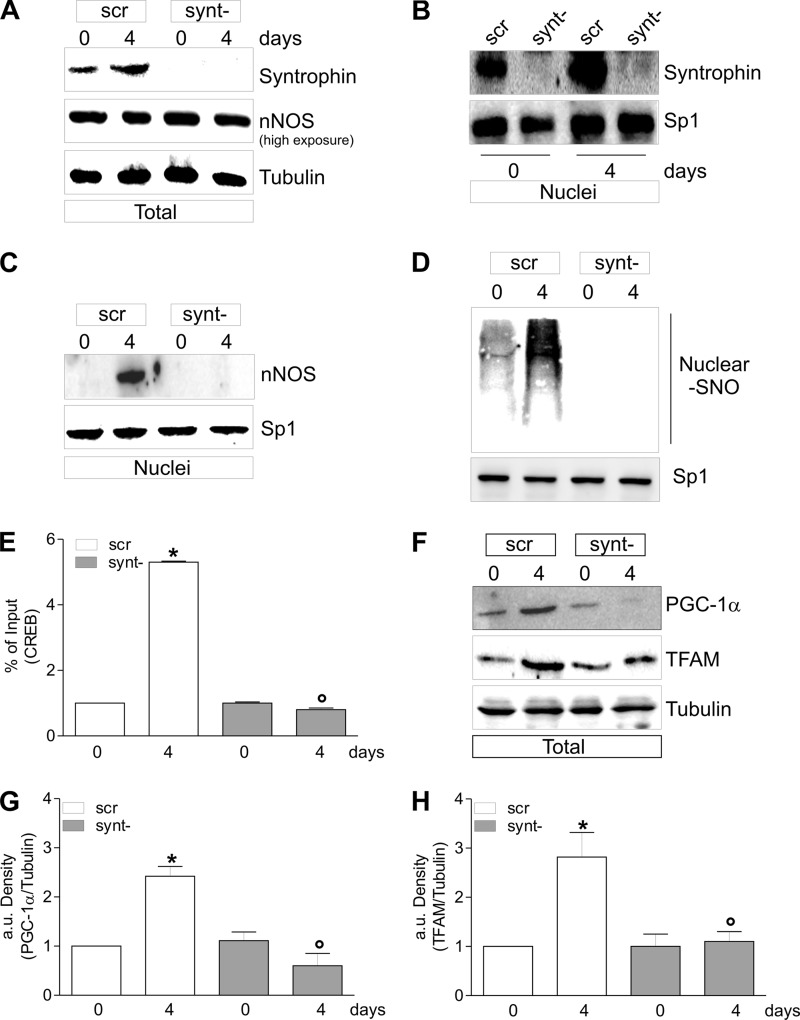
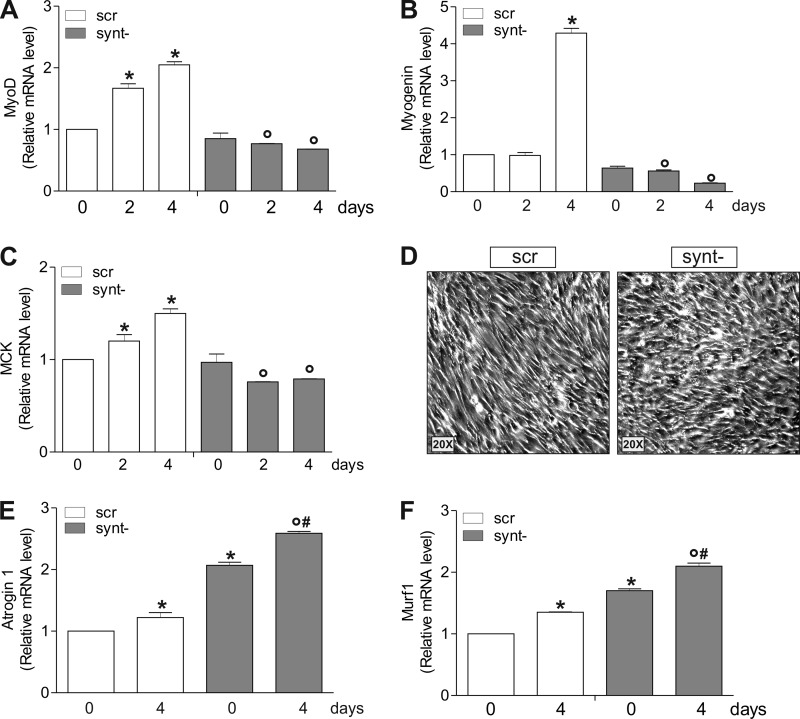
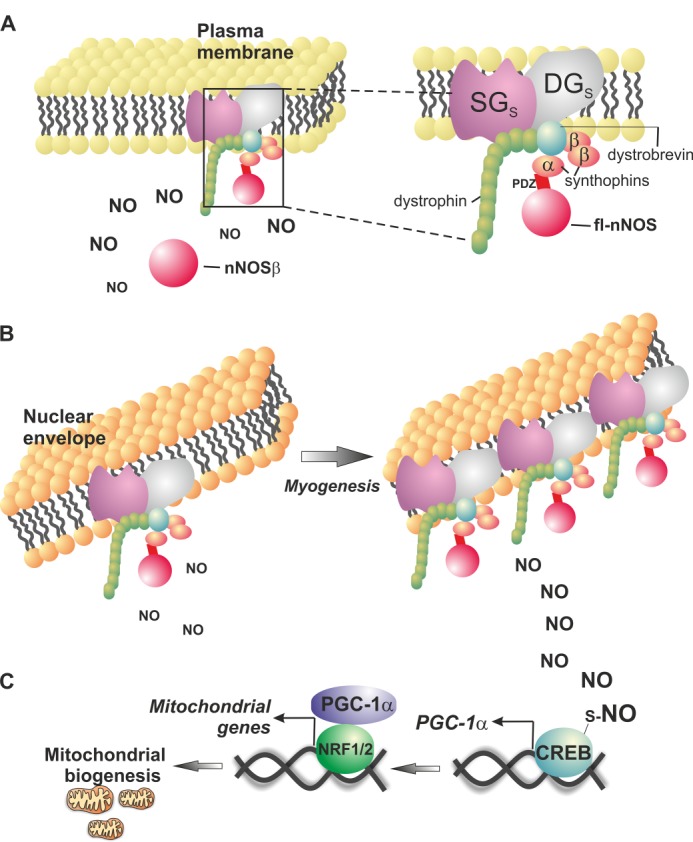
Neuronal nitric-oxide synthase (nNOS) has various splicing variants and different subcellular localizations. nNOS can be found also in the nucleus; however, its exact role in this compartment is still not completely defined. In this report, we demonstrate that the PDZ domain allows the recruitment of nNOS to nuclei, thus favoring local NO production, nuclear protein S-nitrosylation, and induction of mitochondrial biogenesis. In particular, overexpression of PDZ-containing nNOS (nNOSα) increases S-nitrosylated CREB with consequent augmented binding on cAMP response element consensus sequence on peroxisome proliferator-activated receptor γ co-activator (PGC)-1α promoter. The resulting PGC-1α induction is accompanied by the expression of mitochondrial genes (e.g., TFAM, MtCO1) and increased mitochondrial mass. Importantly, full active nNOS lacking PDZ domain (nNOSβ) does not localize in nuclei and fails in inducing the expression of PGC-1α. Moreover, we substantiate that the mitochondrial biogenesis normally accompanying myogenesis is associated with nuclear translocation of nNOS. We demonstrate that α-Syntrophin, which resides in nuclei of myocytes, functions as the upstream mediator of nuclear nNOS translocation and nNOS-dependent mitochondrial biogenesis. Overall, our results indicate that altered nNOS splicing and nuclear localization could be contributing factors in human muscular diseases associated with mitochondrial impairment.

Keywords: Mitochondria; Myogenesis; Nitric-oxide Synthase; S-Nitrosylation; Scaffold Proteins.


Figures

FIGURE 1.
FIGURE 1.
Effect of fl-nNOS overexpression in C2C12 cells. C2C12 cells were transiently transfected with pcDNA3.1 vector containing cDNA coding for full-length rat nNOS (fl-nNOS or nNOSα) or rat nNOS lacking the PDZ domain (ΔnNOS or nNOSβ) or with empty vector (mock). A, after 24 h from transfection, 20 μg of total protein extracts were loaded for detection of nNOS by Western blot using an antibody directed against the nNOS C terminus. Tubulin was used as loading control. B, the activity of nNOS was determined by measuring the total amount of nitrites plus nitrates (NOx) released in the culture medium. The data are reported as μmol/mg protein and expressed as means ± S.D. (n = 5; *, p < 0.001 versus mock). C, total proteins extracts (500 μg) were subjected to S-NO derivatization with biotin. After Western blot, biotin adducts were identified by incubating nitrocellulose membrane with HRP conjugate streptavidin. Proteins incubated in labeling buffer without ascorbate were used as negative control (− Ascorbate). Tubulin was used as loading control. Immunoblots reported are representative of at least four experiments that gave similar results.
FIGURE 2.
FIGURE 2.
fl-nNOS overexpression elicits mitochondrial biogenesis in C2C12 cells. C2C12 cells were transiently transfected as reported in the legend to Fig. 1. After transfection, the cells were treated with l-NAME (100 μm), LY83583 (LY, 2 μm), or ODQ (10 μm) for 24 h. A–D, total RNA was isolated and relative mRNA levels of PGC-1α (A), TFAM (B), mitochondrial transcription factor B (TFBMI, C), and MtCO1 (D) were analyzed by RT-qPCR. The data are expressed as means ± S.D. (n = 7; *, p < 0.05 versus mock cells; °, p < 0.05 versus untreated fl-nNOS cells). E, DNA was extracted, and relative mitochondrial content was assayed by analyzing the D-loop noncoding mtDNA region through qPCR. The D-loop value was normalized to RPL. The data are expressed as means ± S.D. (n = 6; *, p < 0.001 versus mock; °, p < 0.01 versus untreated fl-nNOS). F, cells were incubated with MitoTracker Red for 30 min, and mitochondrial content was assayed by cytofluorimetric analysis. The data are expressed as percentages of MitoTracker Red-positive cells (n = 4; *, p < 0.05 versus mock cells; °, p < 0.05 versus untreated fl-nNOS cells). G, 20 μg of total protein extracts were loaded for detection of PGC-1α and TFAM by Western blot. Tubulin was used as loading control. Immunoblots reported are representative of at least four experiments that gave similar results.
FIGURE 3.
FIGURE 3.
fl-nNOS overexpression induces mitochondrial biogenesis in HeLa cells. HeLa cells were transiently transfected with pcDNA3.1 vector containing cDNA coding for full-length rat nNOS (fl-nNOS or nNOSα) or rat nNOS lacking the PDZ domain (ΔnNOS or nNOSβ) or with empty vector (mock). A, 20 μg of total protein extracts were loaded for detection of nNOS by Western blot using an antibody directed against the nNOS C terminus. Tubulin was used as loading control. Immunoblots reported are representative of at least four experiments that gave similar results. B, the activity of nNOS was determined by measuring the total amount of nitrites plus nitrates (NOx) released in the culture medium. The data are reported as μmol/mg protein and expressed as means ± S.D. (n = 5; *, p < 0.001 versus mock). C–E, after transfection, cells were treated with l-NAME (100 μm) or ODQ (10 μm) for 24 h. Total RNA was isolated, and relative mRNA levels of PGC-1α (C), TFAM (D), and TFBM1 (E) were analyzed by RT-qPCR. The data are expressed as means ± S.D. (n = 7; *, p < 0.05 versus mock; °, p < 0.05 versus untreated fl-nNOS). TFBMI, mitochondrial transcription factor B.
FIGURE 4.
FIGURE 4.
fl-nNOS nuclear localization promotes CREB S-nitrosylation and its increased binding to PGC-1α promoter in C2C12 cells. C2C12 cells were transiently transfected as reported in Fig. 1. A, after 24 h from transfection, 20 μg of nuclear protein extracts were loaded for detection of nNOS by Western blot using an antibody directed against nNOS C terminus. Sp1 was used as loading control. The possible presence of cytoplasmic contaminants was tested by incubating nitrocellulose with rabbit anti-LDH. B, after 24 h from transfection, the nuclear proteins (500 μg) were subjected to S-NO derivatization with biotin. After Western blot, biotin adducts were identified by incubating nitrocellulose membrane with HRP conjugate streptavidin. Proteins incubated in labeling buffer without ascorbate were used as negative control (− Ascorbate). Sp1 was used as loading control. C, after transfection, cells were treated with l-NAME (100 μm), LY83583 (2 μm), or ODQ (10 μm) for 24 h. 20 μg of total protein extracts were loaded for detection of CREB by Western blot. Tubulin was used as loading control. D, after 24 h from transfection, the nuclear proteins (500 μg) were subjected to S-NO derivatization with biotin. After Western blot, the nitrocellulose was incubated with CREB antibody for detection of CREB-SNO. 20 μg of nuclear extracts were used also for detection of CREB by Western blot. Sp1 was used as loading control. The possible presence of nuclear contaminants was tested by incubating nitrocellulose with rabbit anti-LDH. The level of S-nitrosylated CREB (CREB-SNO) was quantified by densitometric analysis (right panel). The data are expressed as CREB-SNO/CREB (n = 3). E, ChIP assay was carried out on cross-linked nuclei from mock, fl-nNOS, and ΔnNOS cells, using CREB antibody followed by qPCR analysis of cAMP response element. The data are expressed as means ± S.D. (n = 3; *, p < 0.001 versus mock; °, p < 0.05 versus untreated fl-nNOS). F, intact nuclei of C2C12 cells were incubated with 5 mm GSNO at 4 °C for 30 min. Nuclear protein extracts (500 μg) were subjected to oligonucleotide pulldown by using the biotinylated oligonucleotide representing the cAMP response element on the PGC-1α promoter, and bound CREB was detected by Western blot. 20 μg of nuclear proteins (input) was used for Western blot analysis of Sp1. Immunoblots reported are representative of at least four experiments that gave similar results.
FIGURE 5.
FIGURE 5.
α-Syntrophin is responsible for nNOS nuclear recruitment and induction of mitochondrial biogenesis. Mock and fl-nNOS C2C12 cells were transiently transfected with α-Syntrophin siRNA (synt−) or with a scramble siRNA (scr). A, 20 μg of total protein extracts were loaded for detection of α-Syntrophin by Western blot. B, 20 μg of total protein extracts were loaded for detection of α-Syntrophin and nNOS by Western blot (an antibody directed against nNOS N terminus was used). Sp1 was used as loading control. C and D, total RNA was isolated, and relative mRNA levels of PGC-1α (C) and TFAM (D) were analyzed by RT-qPCR. The data are expressed as means ± S.D. (n = 9; *, p < 0.001 versus mock/scr; °, p < 0.05 versus fl-nNOS). E and F, MtCO1 (E) and TFBM1 (F) were analyzed by RT-qPCR. The data are expressed as means ± S.D. (n = 4; *, p < 0.001 versus mock/scr; °, p < 0.05 versus fl-nNOS). G, DNA was extracted, and relative mitochondrial content was assayed by analyzing the D-loop noncoding mtDNA region through qPCR. D-loop value was normalized to RPL. The data are expressed as means ± S.D. (n = 4; *, p < 0.001 versus mock/scr; °, p < 0.05 versus fl-nNOS). H, 20 μg of total protein extracts were loaded for detection of nNOS, PGC-1α, and TFAM by Western blot. Immunoblots reported are representative of at least four experiments that gave similar results. TFBMI, mitochondrial transcription factor B.
FIGURE 6.
FIGURE 6.
nNOS and α-Syntrophin are recruited to nuclei during C2C12 differentiation. C2C12 cells were differentiated for 0, 2, 4, and 6 days. A, 20 μg of total protein extracts were loaded for detection of PGC-1α and TFAM by Western blot. Tubulin was used as loading control. B, open symbols, DNA was extracted, and relative mtDNA content was assayed by analyzing D-loop level through qPCR. Filled symbols, the increase of PGC-1α (♦) and TFAM (■) was quantified by densitometric analysis of the immunoreactive bands. The data are reported as D-loop/RPL or PGC-1α/Tubulin and TFAM/Tubulin. The data are expressed as means ± S.D. (n = 4; *, p < 0.001 versus day 0). C, 20 μg of nuclear, cytoplasmic, and total protein extracts were loaded for detection of nNOS (using N terminus antibody) and α-Syntrophin by Western blot. Sp1 and LDH were used for assaying the purity of fractions and/or as loading controls. D and E, 500 μg of total (D) and nuclear (E) protein extracts were subjected to S-NO derivatization with biotin. After Western blot, biotin adducts were identified by incubating nitrocellulose membrane with HRP conjugate streptavidin. β-Tubulin and Sp1 were used as loading controls. Immunoblots reported are representative of at least four experiments that gave similar results.
FIGURE 7.
FIGURE 7.
α-Syntrophin down-regulation impairs mitochondrial biogenesis during C2C12 differentiation. C2C12 cells were transiently transfected with α-Syntrophin siRNA (synt−) or with a scramble siRNA (scr). A, 20 μg of total protein extracts were loaded for detection of nNOS (an antibody directed against nNOS N terminus was used) and α-Syntrophin by Western blot. Tubulin was used as loading control. B, 20 μg of nuclear protein extracts were loaded for detection of α-Syntrophin by Western blot. Sp1 was used as loading control. C, 20 μg of nuclear protein extracts were loaded for detection of nNOS by Western blot using N terminus antibody. Sp1 was used as loading control. D, nuclear proteins (500 μg) were subjected to S-NO derivatization with biotin. After Western blot, biotin adducts were identified by incubating nitrocellulose membrane with HRP conjugate streptavidin. Sp1 was used as loading control. E, ChIP assay was carried out on cross-linked nuclei from scr and synt− cells, using CREB antibody followed by qPCR analysis of cAMP response element. The data are expressed as means ± S.D. (n = 5; *, p < 0.001 versus scr day 0; °, p < 0.001 versus scr day 4). F, 20 μg of total protein extracts were loaded for detection of PGC-1α and TFAM by Western blot. β-Tubulin was used as loading control. G and H, the increase of PGC-1α (G) and TFAM (H) was quantified by densitometric analysis. The data are expressed as PGC-1α/Tubulin and TFAM/Tubulin (n = 4; *, p < 0.001 versus scr day 0; °, p < 0.001 versus scr day 4). Immunoblots reported are representative of at least four experiments that gave similar results.
FIGURE 8.
FIGURE 8.
α-Syntrophin down-regulation affects the expression of myogenic and atrophy genes in differentiating C2C12 cells. A–C, C2C12 cells were transiently transfected with α-Syntrophin siRNA (synt−) or with a scramble siRNA (scr). Total RNA was isolated, and relative mRNA levels of MyoD (A), myogenin (B), and muscle creatine kinase (MCK, C) were analyzed by RT-qPCR. The data are expressed as means ± S.D. (n = 6; *, p < 0.001 versus scr cells day 0; °, p < 0.05 versus scr day 2 or day 4). D, morphological analysis of differentiating cells (day 2) by optical microscopy. E and F, total RNA was isolated, and relative mRNA levels of Atrogin 1 (E) and Murf1 (F) were analyzed by RT-qPCR. The data are expressed as means ± S.D. (n = 6; *, p < 0.05 versus scr day 0; °, p < 0.001 versus scr day 4; #, p < 0.05 versus synt− day 0).
FIGURE 9.
FIGURE 9.
Schematic representation of the role of nuclear nNOS and α-Syntrophin in mitochondrial biogenesis. A, PDZ-containing nNOS (fl-nNOS) is located at the plasma membrane and is part of the Dystrophin complex via the anchoring to α-Syntrophin. PDZ-lacking nNOS (nNOSβ) maintains full NO synthetizing activity and localizes in the cytoplasm but not in the nucleus. B, the Dystrophin complex also localizes at the inner membrane of the nuclear envelope (58), and fl-nNOS is recruited into the nucleus via its interaction with α-Syntrophin. Under certain stimuli (e.g., induction of myogenesis), the PDZ domain is responsible for α-Syntrophin-mediated fl-nNOS recruitment to the nucleus and allows NO synthesis directly at the nuclear level. C, this process facilitates S-nitrosylation of nuclear proteins including CREB transcription factor, which binds to PGC-1α promoter and induces mitochondrial biogenesis. During myogenesis, nuclear fl-nNOS and α-Syntrophin content increases in the nucleus, and this triggers mitochondrial biogenesis. SGs, sarcoglycans; DGs, dystroglycans; NRF1/2, nuclear respiratory factor 1 or 2.

References

    1. Förstermann U., Sessa W. C. (2012) Nitric oxide synthases. Regulation and function. Eur. Heart J. 33, 829–837 - PMC - PubMed
    1. Rotilio G., Aquilano K., Ciriolo M. R. (2003) Interplay of Cu,Zn superoxide dismutase and nitric oxide synthase in neurodegenerative processes. IUBMB Life 55, 629–634 - PubMed
    1. Villanueva C., Giulivi C. (2010) Subcellular and cellular locations of nitric oxide synthase isoforms as determinants of health and disease. Free Radic Biol. Med. 49, 307–316 - PMC - PubMed
    1. Zhou L., Zhu D. Y. (2009) Neuronal nitric oxide synthase. Structure, subcellular localization, regulation, and clinical implications. Nitric Oxide 20, 223–230 - PubMed
    1. Sullivan J. C., Pollock J. S. (2003) NOS 3 subcellular localization in the regulation of nitric oxide production. Acta Physiol. Scand. 179, 115–122 - PubMed

Publication types

MeSH terms