

Activity profiles of soccer players during the 2010 world cup
- PMID: 24235995
- PMCID: PMC3827759
- DOI: 10.2478/hukin-2013-0060
Activity profiles of soccer players during the 2010 world cup
Abstract
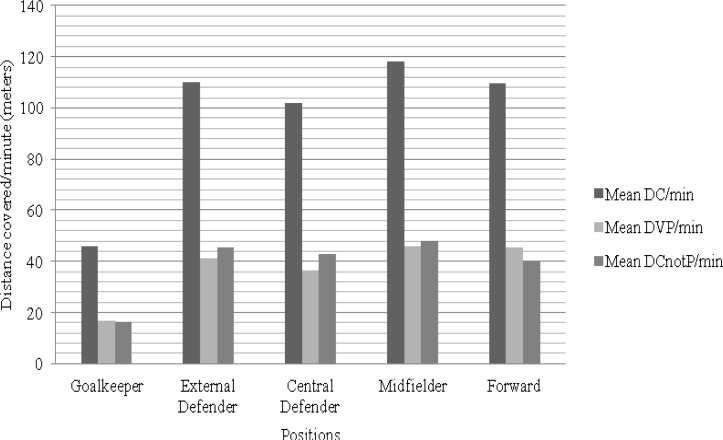
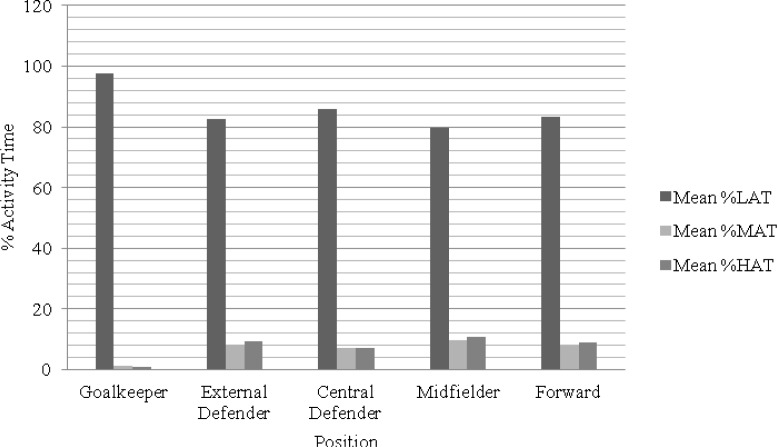
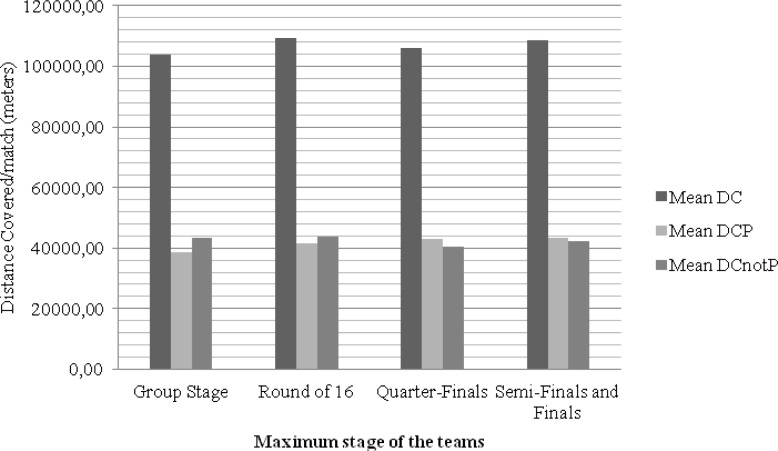
The main objective of this study was to analyse the distance covered and the activity profile that players presented at the FIFA World Cup in 2010. Complementarily, the distance covered by each team within the same competition was analysed. For the purposes of this study 443 players were analysed, of which 35 were goalkeepers, 84 were external defenders, 77 were central defenders, 182 were midfielders, and 65 were forwards. Afterwards, a thorough analysis was performed on 16 teams that reached the group stage, 8 teams that achieved the round of 16, 4 teams that reached the quarter-finals, and 4 teams that qualified for the semi-finals and finals. A comparison of the mean distance covered per minute among the playing positions showed statistically significant differences (F(4,438) = 559.283; p < 0.001; 2 = 0.836; Power = 1.00). A comparison of the activity time among tactical positions also resulted in statistically significant differences, specifically, low activity (F(4,183.371) = 1476.844; p < 0.001; 2 = 0.742; Power = 1.00), medium activity (F(4,183.370) = 1408.106; p < 0.001; 2 = 0.731; Power = 1.00), and high activity (F(4,182.861) = 1152.508; p < 0.001; 2 = 0.703; Power = 1.00). Comparing the mean distance covered by teams, differences that are not statistically significant were observed (F(3,9.651) = 4.337; p < 0.035; 2 = 0.206; Power = 0.541). In conclusion, the tactical positions of the players and their specific tasks influence the activity profile and physical demands during a match.
Keywords: Soccer; activity profile; match analysis; player’s position.
Figures
References
-
- Akritas MG, Papadatos N. Heteroscedastioc One-Way ANOVA and Lack-of-Fit Tests. Journal of the American Statistical Association. 2004;99:368–390.
-
- Bangsbo J. The physiology of soccer – with special reference to intense intermittent exercise. Acta Physiologica Scandinavica. 1994;151:1–156. - PubMed
-
- Bangsbo J, NØrregaard L, ThorsØ F. Activity profile of competition soccer. Canadian Journal of Sport Sciences. 1991;16:110–116. - PubMed
LinkOut - more resources
Full Text Sources
Other Literature Sources
Miscellaneous