. 2013 Nov 13;8(11):e79127.
doi: 10.1371/journal.pone.0079127. eCollection 2013.

Molecular cloning and characterization of porcine Na⁺/K⁺-ATPase isoforms α1, α2, α3 and the ATP1A3 promoter

Affiliations

Molecular cloning and characterization of porcine Na⁺/K⁺-ATPase isoforms α1, α2, α3 and the ATP1A3 promoter

Carina Henriksen et al. PLoS One. .

Abstract

Na⁺/K⁺-ATPase maintains electrochemical gradients of Na⁺ and K⁺ essential for a variety of cellular functions including neuronal activity. The α-subunit of the Na⁺/K⁺-ATPase exists in four different isoforms (α1-α4) encoded by different genes. With a view to future use of pig as an animal model in studies of human diseases caused by Na⁺/K⁺-ATPase mutations, we have determined the porcine coding sequences of the α1-α3 genes, ATP1A1, ATP1A2, and ATP1A3, their chromosomal localization, and expression patterns. Our ATP1A1 sequence accords with the sequences from several species at five positions where the amino acid residue of the previously published porcine ATP1A1 sequence differs. These corrections include replacement of glutamine 841 with arginine. Analysis of the functional consequences of substitution of the arginine revealed its importance for Na⁺ binding, which can be explained by interaction of the arginine with the C-terminus, stabilizing one of the Na⁺ sites. Quantitative real-time PCR expression analyses of porcine ATP1A1, ATP1A2, and ATP1A3 mRNA showed that all three transcripts are expressed in the embryonic brain as early as 60 days of gestation. Expression of α3 is confined to neuronal tissue. Generally, the expression patterns of ATP1A1, ATP1A2, and ATP1A3 transcripts were found similar to their human counterparts, except for lack of α3 expression in porcine heart. These expression patterns were confirmed at the protein level. We also report the sequence of the porcine ATP1A3 promoter, which was found to be closely homologous to its human counterpart. The function and specificity of the porcine ATP1A3 promoter was analyzed in transgenic zebrafish, demonstrating that it is active and drives expression in embryonic brain and spinal cord. The results of the present study provide a sound basis for employing the ATP1A3 promoter in attempts to generate transgenic porcine models of neurological diseases caused by ATP1A3 mutations.


Conflict of interest statement

Competing Interests: The authors have declared that no competing interests exist.

Figures

Figure 1
Figure 1. Comparison of the porcine Na+/K+-ATPase α1 amino acid sequence with previously published α1 sequences from pig and other species.
Pig (Sus scrofa A, GQ340774 and Sus scrofa B, NM214249), human (Homo sapiens, NM000701), mouse (Mus musculus, NM144900), rat (Rattus norvegicus, NM012504), zebrafish (Danio rerio, NM131686), cattle (Bos taurus, NM001076798), horse (Equus caballus, NM001114532), dog (Canis lupus, NM001003306), chicken (Gallus gallus, NM205521), duck (Anas platyrhynchos, EU004277), and frog (Xenopus tropicalis, NM204076). The amino acids indicated in red show the five positions where our porcine sequence (GQ340774) differs from the previously described porcine Na+/K+-ATPase α1-sequence (NM214249). The numbering of the residues refers to the porcine sequence after posttranslational cleavage of the first five amino acid residues. * indicates identity in all the species.
Figure 2
Figure 2. Structural relation of Arg841 to the C-terminus.
The high resolution crystal structure of the K+-bound E2 form of shark Na+/K+-ATPase is shown (a structure of the Na+ bound E1 form has not been published). The shark Na+/K+-ATPase has an arginine at the position corresponding to Arg841 in the porcine α1-sequence presented here, and the relation of the arginine to the C-terminus can therefore be visualized using the structure of the shark enzyme. A. Overview of the crystal structure (cytoplasmic side up). The α-subunit is shown in grey, except the 11 most C-terminal residues, which are colored wheat. The β-subunit is violet, the FXYD protein is blue, and the two bound K+ ions are depicted as dark blue spheres. The two C-terminal tyrosines and the arginine homologous to Arg841 in pig are shown as wheat and green sticks, respectively. MgF4 2− bound as phosphate analog in the cytoplasmic P-domain is colored green. B. Close up of the arginine homologous to Arg841 in pig showing its closeness to the C-terminal carboxyl group as well as the main-chain carbonyl oxygen of the penultimate tyrosine. These interactions would not be possible with the glutamine erroneously assigned to position 841 in the previously published porcine α1-sequence.
Figure 3
Figure 3. Functional importance of Arg841.
The rat α1 Na+/K+-ATPase Arg843 homologous to pig Arg841 was replaced by alanine (“mutant”) and the functional consequences analyzed (see also Methods). Wild type, closed circles; mutant, open circles. The standard errors are indicated as error bars (seen only when larger than the size of the symbols). A. Na+ dependence of phosphorylation. Phosphorylation was carried out for 10 s at 0°C in the presence of 2 µM [γ-32P]ATP in P-medium with oligomycin and the indicated concentrations of Na+. Each line shows the best fit of the Hill equation, giving K 0.5(Na+) values of 0.50±0.01 mM for wild type and 1.07±0.04 mM for the mutant. B. K+ dependence of Na+/K+-ATPase activity. The ATPase activity was measured at 37°C in A-medium with 40 mM Na+, 3 mM ATP, and the indicated concentrations of K+. Each line shows the best fit of the Hill equation, giving K 0.5(K+) values of 0.67±0.01 mM for wild type and 0.50±0.02 mM for the mutant. C. ATP dependence of Na+/K+-ATPase activity. The ATPase activity was measured at 37°C in A-medium with 130 mM Na+, 20 mM K+, and the indicated concentrations of ATP. Each line shows the best fit of the Hill equation, giving K 0.5(ATP) values of 0.50±0.03 mM for wild type and 0.43±0.04 mM for the mutant. D. Vanadate dependence of Na+/K+-ATPase activity. The ATPase activity was measured at 37°C in A-medium with 130 mM Na+, 20 mM K+, 3 mM ATP, and the indicated concentrations of vanadate. Each line shows the best fit of the Hill equation for inhibition, giving K 0.5(vanadate) values of 2.2±0.1 µM for wild type and 2.4±0.1 µM for the mutant. E. Distribution of phosphoenzyme intermediates between E1P and E2P. Phosphorylation was carried out for 10 s at 0°C in the presence of 2 µM [γ-32P]ATP in P-medium with 20 mM Na+. Dephosphorylation was initiated by addition of 1 mM non-radioactive ATP and 2.5 mM ADP and terminated by acid quenching at the indicated times. Each line shows the best fit of a bi-exponential decay function giving amplitudes (corresponding to E2P) for the slow phase of 63±4% for wild type and 84±8% for the mutant. F. Rate of E1P→E2P interconversion. Phosphorylation was carried out for 15 s at 0°C in the presence of 2 µM [γ-32P]ATP in P-medium with 600 mM Na+. Dephosphorylation was initiated by addition of a chase solution producing final concentrations of 600 mM Na+, 20 mM K+, and 1 mM non-radioactive ATP in addition to the components in the P-medium, and terminated by acid quenching at the indicated times. Each line shows the best fit by a bi-exponential decay function giving rate constants for the slow phase (corresponding to the E1P→E2P interconversion) of 0.14±0.05 s−1 for wild type and 0.43±0.18 s−1 for the mutant.
Figure 4
Figure 4. Comparison of the porcine Na+/K+-ATPase α3 amino acid sequence with α3-sequences from other species.
Pig (Sus scrofa, GQ340775), human (Homo sapiens, NM152296), mouse (Mus musculus, BC037206), rat (Rattus norvegicus, NM012506), chicken (Gallus gallus, NM205475), frog (Xenopus laevis, 001086971), and rainbow trout (Oncorhynchus mykiss, NM001124630). The amino acids indicated in red show the five positions where porcine and human sequences differ. The numbering of the residues refers to the porcine sequence (the first five residues removed by posttranslational modification are not numbered). * indicates identity in all seven species.
Figure 5
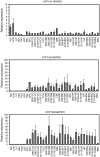
Figure 5. Relative expression pattern of porcine ATP1A1, ATP1A2, and ATP1A3 mRNA in different organs and tissues from adult pigs and from brain tissues at different stages of embryonic development.
GAPDH is used as endogenous reference. Each column represents the mean expression of a triplicate from three different pigs. The considerable biological variation between the animals represented in each column is indicated by error bars showing the standard deviation. KID: kidney, LUN: lung, LIV: liver, HEA: heart, THG: thyroid gland, LDO: longissimus dorsi, PGL: pituitary gland, SPC: spinal cord, FCO: frontal cortex, CBE: cerebellum; BST: brain stem, HIP: hippocampus, BSG: basal ganglia, D60: embryo of day 60, D80: embryo of day 80, D100: embryo of day 100, D115: embryo of day 115.
Figure 6
Figure 6. Comparative expression levels of porcine ATP1A1, ATP1A2, and ATP1A3 mRNA in different organs and tissues from adult pigs.
β-actin (b_ACT) is used as endogenous reference. Each column represents the mean expression of a triplicate from three different pigs. The considerable biological variation between the animals represented in each column is indicated by error bars showing the standard deviation. FCO: frontal cortex, CBE: cerebellum, HIP: hippocampus, BST: brain stem, HEA: heart, LDO: longissimus dorsi, BFE: biceps femoris, KID: kidney.
Figure 7
Figure 7. Western blot showing the α3-isoform specifically expressed in porcine neural tissues.
An α3-specific antibody reactive band of approximately 112 kDa corresponding to Na+/K+-ATPase is present in all brain tissues analyzed and in the spinal cord. Cell lysate from COS-1 cells stably expressing ATP1A3 was used as positive control.
Figure 8
Figure 8. Comparison of the cloned porcine ATP1A3 promoter with the human ATP1A3 promoter.
Nucleotides are numbered with reference to the putative transcriptional start site (+1). Lines indicate putative transcription factor binding sites. The CCAAT and TATA boxes are indicated in bold italics. Bold ATG indicates the start site of translation. Hs: Homo sapiens, Ss: Sus scrofa. Following the abbreviation of the species, the accession numbers are shown.
Figure 9
Figure 9. Schematic representation of elements in the minimal Tol2-vector construct, Tol2-pATP1A3:GFP, used for transgenesis in zebrafish.
This construct is modified from the pT2AL200R150G plasmid . Tol2: the left and right terminal regions of the full-length Tol2, ATP1A3p: the porcine ATP1A3 promoter sequence, GFP: Green Fluorescence Protein, Intron: the rabbit β-globin intron, polyA: SV40 polyA signal.
Figure 10
Figure 10. Specificity of ATP1A3 promoter driven expression of GFP in zebrafish embryos.
A. and B. Weak GFP expression in the central nervous system and cells of the pronephros in F1 embryo 54 hours post fertilization. C. Mosaic expression in individual cells of the neural tube driven by the ATP1A3 promoter in a representative embryo of the injected generation.

References

    1. Skou JC (1957) The influence of some cations on an adenosine triphosphatase from peripheral nerves. Biochim Biophys Acta 23: 394–401. - PubMed
    1. Glynn IM (1993) Annual review prize lecture. ‘All hands to the sodium pump’. J Physiol 462: 1–30. - PMC - PubMed
    1. Post RL, Hegyvary C, Kume S (1972) Activation by adenosine triphosphate in the phosphorylation kinetics of sodium and potassium ion transport adenosine triphosphatase. J Biol Chem 247: 6530–6540. - PubMed
    1. Tokhtaeva E, Sachs G, Vagin O (2009) Assembly with the Na,K-ATPase alpha(1) subunit is required for export of beta(1) and beta(2) subunits from the endoplasmic reticulum. Biochemistry 48: 11421–11431. - PMC - PubMed
    1. Morth JP, Pedersen BP, Toustrup-Jensen MS, Sorensen TL, Petersen J, et al. (2007) Crystal structure of the sodium-potassium pump. Nature 450: 1043–1049. - PubMed

Publication types

MeSH terms

Substances

LinkOut - more resources