. 2013 Nov 15:13:251.
doi: 10.1186/1471-2148-13-251.

Molecular adaptation of telomere associated genes in mammals

Molecular adaptation of telomere associated genes in mammals

Claire C Morgan et al. BMC Evol Biol. .

Abstract

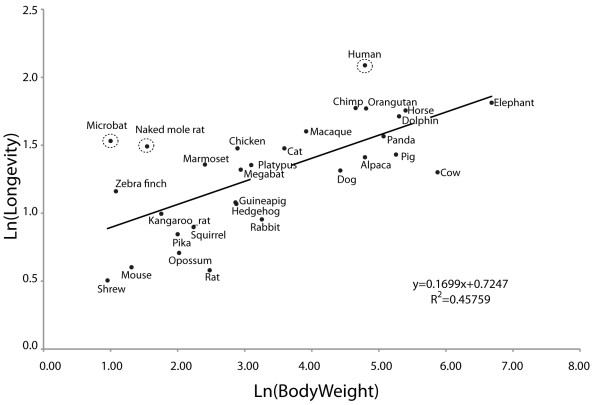
Background: Placental mammals display a huge range of life history traits, including size, longevity, metabolic rate and germ line generation time. Although a number of general trends have been proposed between these traits, there are exceptions that warrant further investigation. Species such as naked mole rat, human and certain bat species all exhibit extreme longevity with respect to body size. It has long been established that telomeres and telomere maintenance have a clear role in ageing but it has not yet been established whether there is evidence for adaptation in telomere maintenance proteins that could account for increased longevity in these species.

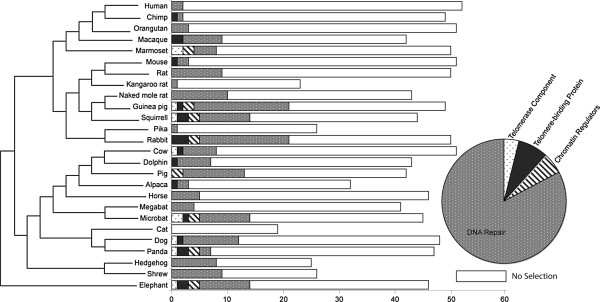
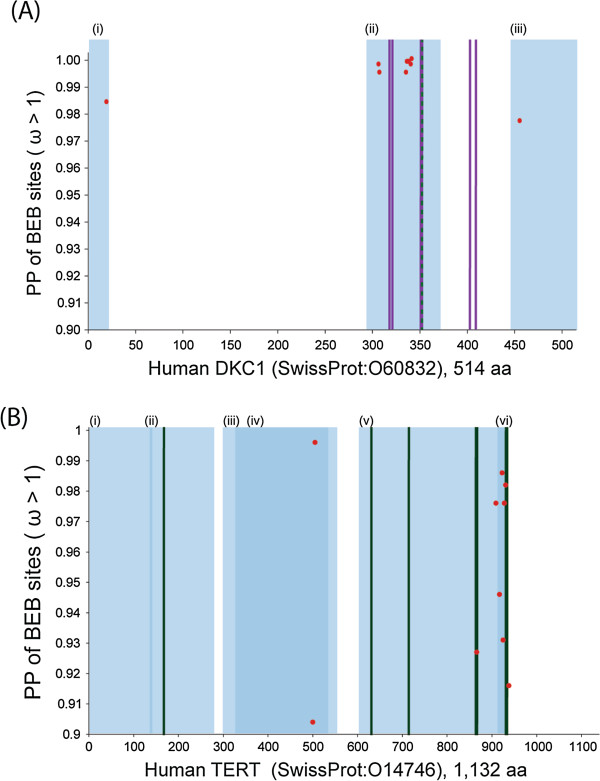
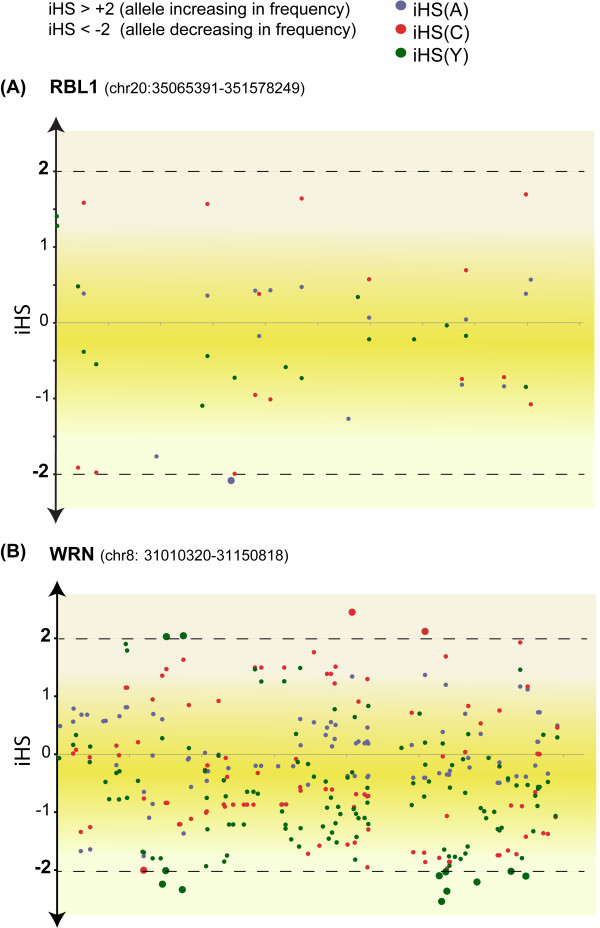
Results: Here we carry out a molecular investigation of selective pressure variation, specifically focusing on telomere associated genes across placental mammals. In general we observe a large number of instances of positive selection acting on telomere genes. Although these signatures of selection overall are not significantly correlated with either longevity or body size we do identify positive selection in the microbat species Myotis lucifugus in functionally important regions of the telomere maintenance genes DKC1 and TERT, and in naked mole rat in the DNA repair gene BRCA1.

Conclusion: These results demonstrate the multifarious selective pressures acting across the mammal phylogeny driving lineage-specific adaptations of telomere associated genes. Our results show that regardless of the longevity of a species, these proteins have evolved under positive selection thereby removing increased longevity as the single selective force driving this rapid rate of evolution. However, evidence of molecular adaptations specific to naked mole rat and Myotis lucifugus highlight functionally significant regions in genes that may alter the way in which telomeres are regulated and maintained in these longer-lived species.


Figures

Figure 1
Figure 1
Plot of the maximum longevity versus body weight for a collection of amniotes. The natural log (lnL) of body weight is plotted against the lnL of longevity for the species analysed in this study. The regression line indicates a correlation between both life history traits. The exceptions are microbat (M. lucifugus), human and naked mole rat circled to highlight their extreme values.
Figure 2
Figure 2
Overview of levels of lineage-specific positive selection on telomere associated genes in each lineage of mammal. Each of the 52 telomere associated genes are categorized into 4 major functional groups (colour coded as per pie chart inset). On the left is the placental mammal phylogeny used. The maximum length of each horizontal bar in the histogram depicts the overall number of times that species was represented in the total dataset of 52 gene families. The shaded portions of the bars correspond to the functional categories (as per colour scheme in the pie chart), the size of these shaded regions represents the proportion of genes in that category that are identified as having undergone lineage-specific positive selection.
Figure 3
Figure 3
Lineage-specific positive selection in the naked mole rat BRCA1/FANC pathway. (A) The BRCA1/FANC pathway with genes under positive selection in naked mole rat denoted by a star. (B) Is a graphic of the BRCA1 protein from position 1 to 1853 on the x-axis. Positively selected sites (red dots) from naked mole rat were mapped to model sequence (from human). The posterior probability for each site is given on the y-axis. Functional information extracted from the human entry in swissport is colour coded as follows: blue regions represent (i) Zinc Finger, (ii) Interaction region with PALB2, (iii) BRCT1 domain, and (iv) BRCT2 domain while purple vertical lines are cancer causing natural variants.
Figure 4
Figure 4
Functional assessment of positively selected sites from Myotis lucifugus by comparison to human orthologs. In both (A) and (B) the amino acid position of the human gene is given on the x-axis and the PP of a given site being under positive selection is given on the y-axis. (A) are the results for DKC1 and (B) are the results for TERT. Positively selected sites are shown as red dots throughout and different domains are denoted with roman numerals and are highlighted by blue semi-transparent blocks. For (A) blue shaded regions are: (i) nucleolar localization, (ii) PUA domain, and (iii), nuclear and nucleolar localization respectively. In (B) mutagenesis sites which result in reduced telomerase activity are represented by vertical green lines, and blue shaded regions are: (i) RNA-interacting domain 1, (ii) Required for regulating specificity for telomeric DNA, (iii) Required for oligomerization, (iv) RNA-interacting domain 2, (v) Reverse transcriptase, and (vi), Required for oligomerization. The purple vertical lines in (A) represent the natural variants resulting in XDKC, and the vertical green lines in (B) represent the position of the natural variants resulting in HH0053.
Figure 5
Figure 5
An overview of SNP frequency within human populations. The results for iHS analysis of the RBL1 gene is given in panel (A) and for the WRN gene id given in panel (B). The iHS scores for SNPs within the East Asian (A), Northern and Western European (C), and African Yoruba (Y) populations are shown as blue, red and green dots respectively. The position of SNPs on the x-axis is proportional to the distance from the first SNP within the gene.

References

    1. de Magalhaes JP, Costa J, Church GM. An analysis of the relationship between metabolism, developmental schedules, and longevity using phylogenetic independent contrasts. J Gerontol A Biol Sci Med Sci. 2007;62(2):149–160. doi: 10.1093/gerona/62.2.149. - DOI - PMC - PubMed
    1. de Magalhaes JP, Costa J. A database of vertebrate longevity records and their relation to other life-history traits. J Evol Biol. 2009;22(8):1770–1774. doi: 10.1111/j.1420-9101.2009.01783.x. - DOI - PubMed
    1. Austad SN. Diverse aging rates in metazoans: targets for functional genomics. Mech Ageing Dev. 2005;126(1):43–49. doi: 10.1016/j.mad.2004.09.022. - DOI - PubMed
    1. Buffenstein R. Negligible senescence in the longest living rodent, the naked mole-rat: insights from a successfully aging species. J Comp Physiol B. 2008;178(4):439–445. doi: 10.1007/s00360-007-0237-5. - DOI - PubMed
    1. Austad SN. Methusaleh’s Zoo: how nature provides us with clues for extending human health span. J Comp Pathol. 2010;142(Suppl 1):S10–S21. - PMC - PubMed

Publication types