Meta-Analysis
. 2013 Nov 15;12(1):140.
doi: 10.1186/1476-4598-12-140.

Expression analysis and in silico characterization of intronic long noncoding RNAs in renal cell carcinoma: emerging functional associations

Affiliations
Meta-Analysis

Expression analysis and in silico characterization of intronic long noncoding RNAs in renal cell carcinoma: emerging functional associations

Angela A Fachel et al. Mol Cancer. .

Abstract

Background: Intronic and intergenic long noncoding RNAs (lncRNAs) are emerging gene expression regulators. The molecular pathogenesis of renal cell carcinoma (RCC) is still poorly understood, and in particular, limited studies are available for intronic lncRNAs expressed in RCC.

Methods: Microarray experiments were performed with custom-designed arrays enriched with probes for lncRNAs mapping to intronic genomic regions. Samples from 18 primary RCC tumors and 11 nontumor adjacent matched tissues were analyzed. Meta-analyses were performed with microarray expression data from three additional human tissues (normal liver, prostate tumor and kidney nontumor samples), and with large-scale public data for epigenetic regulatory marks and for evolutionarily conserved sequences.

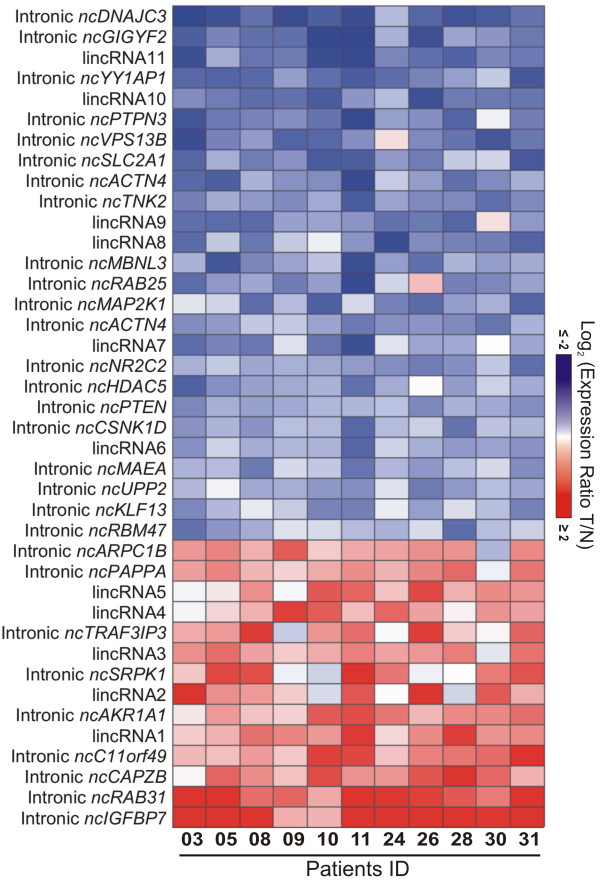
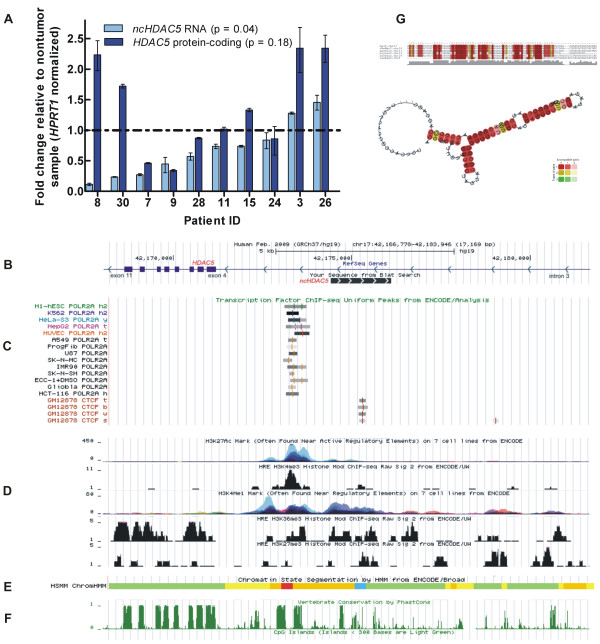
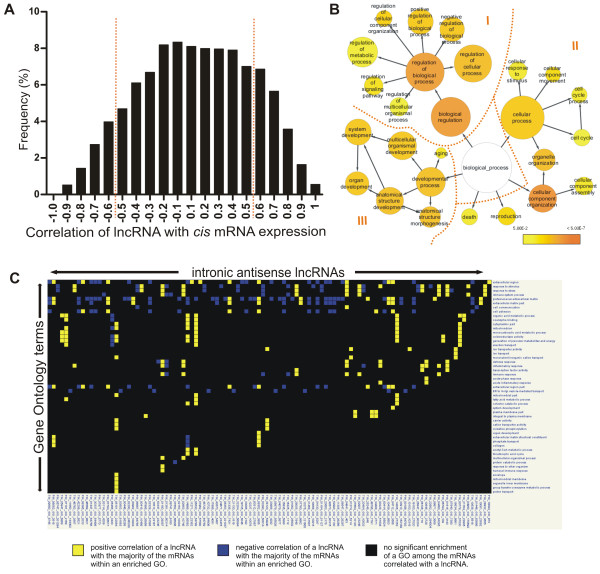
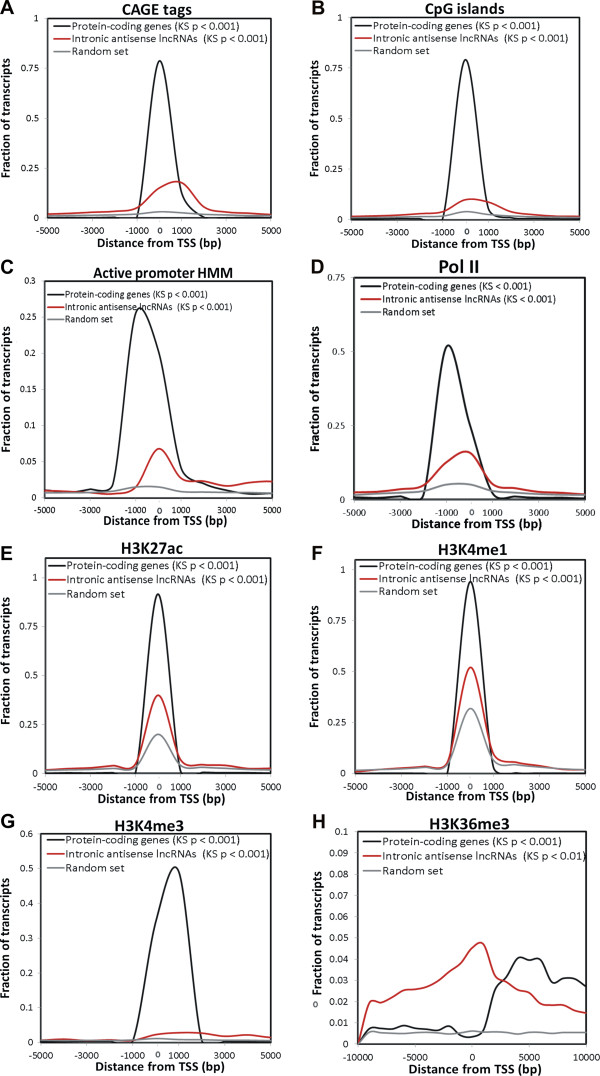
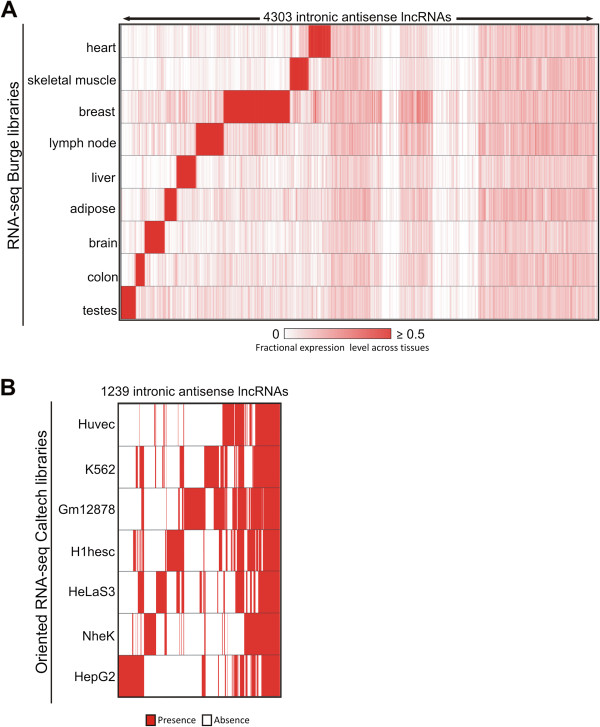
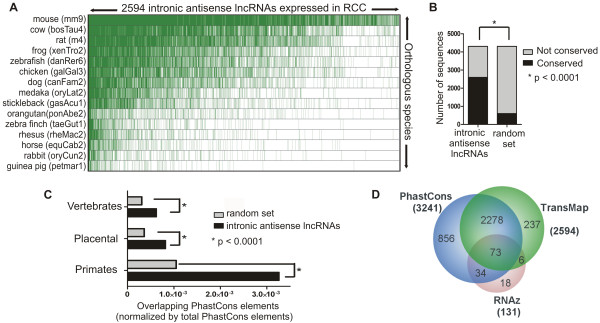
Results: A signature of 29 intronic lncRNAs differentially expressed between RCC and nontumor samples was obtained (false discovery rate (FDR) < 5%). A signature of 26 intronic lncRNAs significantly correlated with the RCC five-year patient survival outcome was identified (FDR < 5%, p-value ≤ 0.01). We identified 4303 intronic antisense lncRNAs expressed in RCC, of which 22% were significantly (p < 0.05) cis correlated with the expression of the mRNA in the same locus across RCC and three other human tissues. Gene Ontology (GO) analysis of those loci pointed to 'regulation of biological processes' as the main enriched category. A module map analysis of the protein-coding genes significantly (p < 0.05) trans correlated with the 20% most abundant lncRNAs, identified 51 enriched GO terms (p < 0.05). We determined that 60% of the expressed lncRNAs are evolutionarily conserved. At the genomic loci containing the intronic RCC-expressed lncRNAs, a strong association (p < 0.001) was found between their transcription start sites and genomic marks such as CpG islands, RNA Pol II binding and histones methylation and acetylation.

Conclusion: Intronic antisense lncRNAs are widely expressed in RCC tumors. Some of them are significantly altered in RCC in comparison with nontumor samples. The majority of these lncRNAs is evolutionarily conserved and possibly modulated by epigenetic modifications. Our data suggest that these RCC lncRNAs may contribute to the complex network of regulatory RNAs playing a role in renal cell malignant transformation.


Figures

Figure 1
Figure 1
lncRNA expression signature of malignancy in clear cell renal cell carcinoma (ccRCC). Heat map of 40 differentially expressed lncRNAs (rows) identified in 11 ccRCC patients (columns). Patient ID numbers are shown at the bottom. (false-discovery-rate <5%; fold-change ≥1.5). There are 29 intronic lncRNAs (identified by their host-gene symbols) and 11 lincRNAs. Blue indicates lower expression, and red, higher expression in tumor (T) tissues in relation to adjacent nontumor (N) tissues.
Figure 2
Figure 2
Relative quantification and transcriptional orientation of intronic lncRNAs differentially expressed in ccRCC. Expression of (A)ncC11orf49, (B)ncHDAC5, (C)ncRAB31 and (D)ncSRPK1 was evaluated in tumor and adjacent nontumor paired samples from clear cell RCC patients by qPCR. Tumor expression relative to paired nontumor in each patient sample is shown. lncRNA expression was normalized by HPRT1 gene expression. The statistical significance of the differential expression was evaluated by the t-test (p < 0.05). (E) For each gene, strand-specific reverse transcription (RT) followed by PCR shows the presence of intronic messages transcribed from the antisense (AS) and/or the sense (S) strands, in a pool of 10 ccRCC tissues, in a pool of 10 matched nontumors, or in the 786-O tumor and the RC-124 nontumor kidney cell lines. A control (C) for the absence of RNA self-annealing during reverse transcription and for the absence of genomic contamination was performed with an RT reaction step without primer (+ RT, - RT primer), followed by PCR with the pair of primers for the corresponding lncRNA.
Figure 3
Figure 3
Characterization of the intronic lncRNA expressed from the HDAC5 locus. (A) Relative abundances of the ncHDAC5 lncRNA (light blue) and of the HDAC5 protein-coding mRNA (dark blue) are shown as fold change in the tumor relative to the matched nontumor sample for each of ten ccRCC patients. Patients are order according to the fold change of the ncHDAC5. (B-F) Regulatory and conserved elements from the ENCODE database are shown at the genomic region of the HDAC5 protein-coding gene from intron 3 to intron 11. Arrowheads in (B) show the opposing directions of transcription of the HDAC5 and the ncHDAC5 RNAs. In (C) the RNA Polymerase II binding sites measured in 14 cell lines, and the CTCF transcriptional repressor insulator binding site are shown. In (D) the histone modification marks H3K27ac, H3K4me3, H3K4me1, H3K36me3 and H3K27me3 are shown. In (E) the HMM histone state segmentation annotation is shown, comprising a predicted active promoter (red), a strong enhancer (orange) and an insulator (blue) region. In (F) the vertebrate conservation and the CpG islands tracks are shown (no marks detected in the latter). (G) The most stable conserved secondary structure predicted by the RNAz tool (P = 0.99) for a segment within ncHDAC5. The segment spans 110 nt along the 1.7 kb-long lncRNA transcribed in the antisense direction in the HDAC5 locus.
Figure 4
Figure 4
Functional associations of intronic antisense lncRNAs expressed in RCC. (A)Cis-correlation analysis. Histogram of Spearman correlation values calculated using the expression levels of intronic lncRNAs and mRNAs expressed in 4303 gene loci, across RCC and three other human tissues (normal liver, prostate tumor and kidney nontumor). (B) GO enrichment analysis of the mRNAs correlated in cis with the lncRNAs from the same loci (Spearman correlation -0.5 > ρ >0.5; p <0.05; see red broken lines in panel A). Color scale indicates increasingly higher statistical significance of enriched GO terms: Yellow, p = 0.05; Dark orange, p <0.0001. (C)Trans-correlation analysis. Module map of lncRNAs and GO enriched terms among trans-correlated mRNAs. Analysis was performed with the 20% most abundant lncRNAs (columns) that showed Spearman correlation values in the ranges -0.7 ≥ ρ ≥0.7 between its expression level in RCC and in three other human tissues (normal liver, prostate tumor and kidney nontumor) and the expression of mRNAs outside the host locus (correlation in trans; p <0.05); GO terms significantly enriched among trans-correlated mRNAs are shown in the rows (p <0.05 with Bonferroni correction). Colors indicate if the majority of the mRNAs within that GO is directly (yellow) or inversely (blue) correlated with the lncRNA. A black entry indicates no significant enrichment. The lists of GO enriched terms and of mRNAs belonging to each term for panels 4B and 4C are given in Additional file 10: Table S7.
Figure 5
Figure 5
Regulatory genomic marks associated with intronic antisense lncRNAs expressed in RCC. Red lines show the abundance distribution of CAGE tags (A), CpG islands (B) and histone marks (C-G) within a distance of 5 kb from the TSSs of the intronic antisense lncRNAs expressed in RCC. For comparison, abundance distribution of these marks for an equal number of protein-coding mRNAs (black lines), or for a control set of randomly selected intronic genomic sequences with the same length of the expressed lncRNAs (grey lines) were calculated. (A) CAGE tags, (B) CpG islands, (C) active promoter HMM predictions, (D) RNA polymerase II binding sites, (E) transcriptional activation histone mark H3K27ac, (F) transcriptional activation histone mark H3K4me1, (G) promoter-associated histone mark H3K4me3, and (H) activating-associated histone mark H3K36me3. In parentheses are the significance p-values of Kolmogorov-Smirnov (KS) statistical tests for differences in abundance distribution in relation to the control random set.
Figure 6
Figure 6
Tissue expression pattern of intronic antisense lncRNAs. (A) Heat map representing the abundance of 4303 RCC-expressed intronic antisense lncRNAs (columns) across other nine human tissues (rows) based on public RNA-seq data [68]. Color intensity represents fractional density expression of each lncRNA across all tissues (see Material and methods for details). There are 628 lncRNAs (out of the 4303; i.e. 15%) at the right hand side of this panel that were exclusively detected in RCC. (B) Heat map indicating the presence (red) or the absence (white) of 1239 RCC-expressed lncRNAs (columns) in seven human cell lineages (rows) from public strand-oriented RNA-Seq libraries [69]. These 1239 intronic antisense lncRNAs represent 29% of the 4303 lncRNAs detected in RCC; the other 3064 lncRNAs (71%) were detected exclusively in RCC, not in the cell lines (not shown). Expression data was hierarchically clustered.
Figure 7
Figure 7
Conservation analysis of intronic antisense lncRNAs expressed in RCC. (A) TransMap cross-species cDNA alignments in 15 vertebrate species (rows; species common name and library version in brackets) of 2594 intronic antisense lncRNAs expressed in renal tissue and with conserved expression in at least one species (green dashes show expression conservation). (B) Bar graph of the TransMap analysis showing a higher proportion of expression conservation of the lncRNA dataset compared with a random sequence dataset (Fisher test p <0.0001). (C) DNA sequence conservation of antisense lncRNAs within vertebrates, placental and primates groups. Black bars show the number of lncRNAs, and gray bars the number of random genomic regions, overlapping PhastCons elements (see Material and methods for details). Asterisks show statistically significant differences in the number of overlapping elements (Fisher test p <0.0001). (D) Venn Diagram of three different conservation analyses of the intronic lncRNAs expressed in RCC: RNAz predicted secondary structure conservation for 131 lncRNAs, PhastCons DNA sequence conservation for 3241 lncRNAs and TransMap expression conservation for 2594 lncRNAs.

References

    1. Siegel R, Naishadham D, Jemal A. Cancer statistics, 2013. CA Cancer J Clin. 2013;63:11–30. doi: 10.3322/caac.21166. - DOI - PubMed
    1. Purdue MP, Moore LE, Merino MJ, Boffetta P, Colt JS, Schwartz KL, Bencko V, Davis FG, Graubard BI, Janout V. et al.An investigation of risk factors for renal cell carcinoma by histologic subtype in two case–control studies. Int J Cancer. 2013;132:2640–2647. doi: 10.1002/ijc.27934. - DOI - PMC - PubMed
    1. Eichelberg C, Junker K, Ljungberg B, Moch H. Diagnostic and prognostic molecular markers for renal cell carcinoma: a critical appraisal of the current state of research and clinical applicability. Eur Urol. 2009;55:851–863. doi: 10.1016/j.eururo.2009.01.003. - DOI - PubMed
    1. Vasudev NS, Selby PJ, Banks RE. Renal cancer biomarkers: the promise of personalized care. BMC Med. 2012;10:112. doi: 10.1186/1741-7015-10-112. - DOI - PMC - PubMed
    1. Skubitz KM, Skubitz AP. Differential gene expression in renal-cell cancer. J Lab Clin Med. 2002;140:52–64. doi: 10.1067/mlc.2002.125213. - DOI - PubMed

Publication types

Substances