Review
. 2013 Nov 18;17(6):243.
doi: 10.1186/cc13114.

Clinical review: Lung imaging in acute respiratory distress syndrome patients--an update

Review

Clinical review: Lung imaging in acute respiratory distress syndrome patients--an update

Davide Chiumello et al. Crit Care. .

Abstract

Over the past 30 years lung imaging has greatly contributed to the current understanding of the pathophysiology and the management of acute respiratory distress syndrome (ARDS). In the past few years, in addition to chest X-ray and lung computed tomography, newer functional lung imaging techniques, such as lung ultrasound, positron emission tomography, electrical impedance tomography and magnetic resonance, have been gaining a role as diagnostic tools to optimize lung assessment and ventilator management in ARDS patients. Here we provide an updated clinical review of lung imaging in ARDS over the past few years to offer an overview of the literature on the available imaging techniques from a clinical perspective.


Figures

Figure 1
Figure 1
Illustrative examples of a patient with lobar attenuations (top) and a patient with diffuse attenuations (bottom). Left panels: computed tomography (CT) scan of the right lung; right panels: volumic distribution of CT numbers for the upper lobe. The volumes of gas and tissue computed with Lungview are shown above the CT attenuation histogram. The excess lung tissue present in the upper lobes is similar in the two patients. In contrast, there is four times as much gas in the upper lobe of the patient with lobar attenuations as in the upper lobe of the patient with diffuse attenuations. This difference in the fraction of gas markedly affects the CT image, the upper lobe of the patient with lobar attenuations appearing grossly ‘normal’ whereas the upper lobe of the patient with diffuse attenuations appears ‘abnormal’. Reproduced from [17] with permission from Springer Science and Business Media.
Figure 2
Figure 2
Representative images of cross-registered computed tomography (CT) and [18F]-fluoro-2-deoxy-D-glucose (18-FDG) positron emission tomography from two patients with acute lung injury/acute respiratory distress syndrome. The CT image was acquired during a respiratory pause at mean airway pressure. The gray scale is centered at −500 Hounsfield units with a width of 1,250 Hounsfield units. Positron emission tomographic images represent the average pulmonary 18-FDG concentration during the last 20 minutes of acquisition (from 37 to 57 minutes since 18-FDG administration); the color scale represents radioactivity concentration (kBq/ml). (A) 18-FDG distribution parallels that of the opacities detected on CT. (B) Intense 18-FDG uptake can be observed in normally aerated regions (square 1), while activity is lower in the dorsal, ‘non-aerated’ regions of both lungs (square 2). Reproduced from [44] with permission from Wolters Kluwer Health.
Figure 3
Figure 3
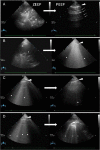
Illustration of positive end-expiratory pressure (PEEP)-induced lung recruitment detected by ultrasound. (A) Left: transverse view of consolidated lower lobe. Lung consolidation appears as a tissue structure (C), and hyperechoic tubular images (star) can be seen, corresponding to dynamic air bronchograms (air-filled bronchi). Right: after PEEP 15 cmH2O, the same lung region appears normally aerated. The pleural line (white arrow) can be seen with multiple horizontal A lines (thin arrows). (B) Left: transverse view of consolidated lower lobe. Lung consolidation appears as a tissue structure (C), and hyperechoic punctiform images (star) can be seen, corresponding to static air bronchograms (air-filled bronchi). Right: after PEEP 15 cmH2O, the same lung region is characterized by multiple coalescent B lines (B2 lines), attesting to the penetration of gas within the consolidation. The pleural line is visible (white arrow), as well as coalescent B lines (stars) arising from the pleural line and spreading up to the edge of the screen. These artifacts correspond to ground-glass areas on chest computed tomography. (C) Left: transverse view of a lung region with alveolar syndrome. Coalescent B lines (stars) arising from the pleural line (white arrow) are present. Right: After PEEP 15 cmH2O, the same lung region appears normally aerated. The pleural line (white arrow) can be seen with an isolated B line (star). (D) Left: transverse view of a lung region with pneumonia. Coalescent B lines (B2 lines) arising from the pleural line (white arrow and stars) or from a juxtapleural consolidation (white circles) are present. Right: after PEEP 15 cmH2O, the same lung region is characterized by multiple well-defined and irregularly spaced B lines (B1 lines), attesting of the penetration of additional gas within the lung region. B1 lines (white circles) arise from juxtapleural consolidations, suggesting the presence of small foci of pneumonia. [82] Copyright©2013 American Thoracic Society. ZEEP; zero-EPP.
Figure 4
Figure 4
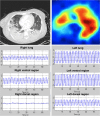
Comparison between a computed tomography scan (left upper panel) and an electrical impedance tomography (EIT) image (right upper panel). The EIT image depicts regional changes in electrical resistivity (impedance) represented by a colour thermal scale. The scale ranges from the colour red (indicating maximal tidal impedance change) to blue (indicating no change in impedance). The lower panels show tidal variations of impedance for each lung region. The regional inhomogeneity in impedance, with a loss of ventilation mainly in the right dorsal region, is due, in this example, to consolidation of the lung parenchyma. The advantage of EIT is that the image might change following recruitment maneuvers, physiotherapy or prone positioning, indicating a response to such treatments.

References

    1. Ashbaugh DG, Bigelow DB, Petty TL, Levine BE. Acute respiratory distress in adults. Lancet. 1967;17:319–323. - PubMed
    1. Camporota L, Ranieri VM. What’s new in the “Berlin” definition of acute respiratory distress syndrome? Minerva Anestesiol. 2012;17:1162–1166. - PubMed
    1. Ferguson ND, Fan E, Camporota L, Antonelli M, Anzueto A, Beale R, Brochard L, Brower R, Esteban A, Gattinoni L, Rhodes A, Slutsky AS, Vincent JL, Rubenfeld GD, Thompson BT, Ranieri VM. The Berlin definition of ARDS: an expanded rationale, justification, and supplementary material. Intensive Care Med. 2012;17:1573–1582. doi: 10.1007/s00134-012-2682-1. - DOI - PubMed
    1. Ranieri VM, Rubenfeld GD, Thompson BT, Ferguson ND, Caldwell E, Fan E, Camporota L, Slutsky AS. Acute respiratory distress syndrome: the Berlin Definition. JAMA. 2012;17:2526–2533. - PubMed
    1. Bellani G, Mauri T, Pesenti A. Imaging in acute lung injury and acute respiratory distress syndrome. Curr Opin Crit Care. 2012;17:29–34. doi: 10.1097/MCC.0b013e32834eb47d. - DOI - PubMed

MeSH terms