. 2013 Nov 18:12:112.
doi: 10.1186/1475-2859-12-112.

Transcriptome signatures of class I and III stress response deregulation in Lactobacillus plantarum reveal pleiotropic adaptation

Affiliations

Transcriptome signatures of class I and III stress response deregulation in Lactobacillus plantarum reveal pleiotropic adaptation

Hermien Van Bokhorst-van de Veen et al. Microb Cell Fact. .

Abstract

Background: To cope with environmental challenges bacteria possess sophisticated defense mechanisms that involve stress-induced adaptive responses. The canonical stress regulators CtsR and HrcA play a central role in the adaptations to a plethora of stresses in a variety of organisms. Here, we determined the CtsR and HrcA regulons of the lactic acid bacterium Lactobacillus plantarum WCFS1 grown under reference (28°C) and elevated (40°C) temperatures, using ctsR, hrcA, and ctsR-hrcA deletion mutants.

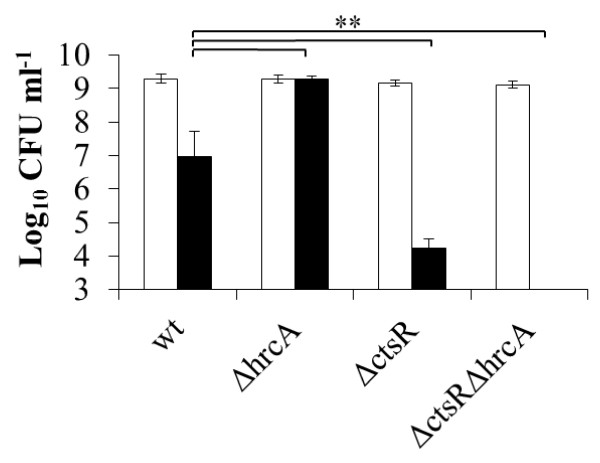
Results: While the maximum specific growth rates of the mutants and the parental strain were similar at both temperatures (0.33 ± 0.02 h(-1) and 0.34 ± 0.03 h(-1), respectively), DNA microarray analyses revealed that the CtsR or HrcA deficient strains displayed altered transcription patterns of genes encoding functions involved in transport and binding of sugars and other compounds, primary metabolism, transcription regulation, capsular polysaccharide biosynthesis, as well as fatty acid metabolism. These transcriptional signatures enabled the refinement of the gene repertoire that is directly or indirectly controlled by CtsR and HrcA of L. plantarum. Deletion of both regulators, elicited transcriptional changes of a large variety of additional genes in a temperature-dependent manner, including genes encoding functions involved in cell-envelope remodeling. Moreover, phenotypic assays revealed that both transcription regulators contribute to regulation of resistance to hydrogen peroxide stress. The integration of these results allowed the reconstruction of CtsR and HrcA regulatory networks in L. plantarum, highlighting the significant intertwinement of class I and III stress regulons.

Conclusions: Taken together, our results enabled the refinement of the CtsR and HrcA regulatory networks in L. plantarum, illustrating the complex nature of adaptive stress responses in this bacterium.


Figures

Figure 1
Figure 1
Maximum specific growth rates of L. plantarum WCFS1 (wt), NZ3410 (ΔctsR), NZ3425CM hrcA), and NZ3423CM ctsRΔhrcA). Specific growth rates are shown for reference (28°C) and elevated (37°C, 40°C, and 42°C) temperatures as indicated in the figure legend. Asterisks indicate p-value < 0.001. Data shown are mean ± standard deviation of 3 independent experiments.
Figure 2
Figure 2
Involvement of CtsR and HrcA in the ability to form colonies at elevated temperature.L. plantarum WCFS1 (wt), NZ3410 (ΔctsR), NZ3425CMhrcA), and NZ3423CMctsRΔhrcA) cultures were serial diluted on MRS plates and incubated at control (30°C; white bars) or elevated temperature (42°C; black bars). Asterisks indicate p-value < 0.001. Data shown are mean ± standard deviation of 3 independent experiments.
Figure 3
Figure 3
Significantly differentially transcribed genes in NZ3410 (ΔctsR), NZ3425CM hrcA), and NZ3423CM ctsRΔhrcA) as compared to the wild-type grown at 28°C (A) or 40°C (B). Yellow colored octangular nodes represent the mutants and other colored nodes indicate main classes. The red and green lines indicate up- or downregulation, respectively. Triangle nodes indicate the CtsR or HrcA transcription regulator, diamond nodes indicate genes that are predicted to be part of the CtsR and/or HrcA regulon, whereas black ovals indicate over-represented main classes or subclasses in that particular main class. The main class “hypothetical proteins” was excluded.
Figure 4
Figure 4
Primary metabolic pathway of L. plantarum NZ3410 (ΔctsR) compared to L. plantarum WCFS1 grown at 40°C. Green lines or triangles indicate downregulation, whereas red lines or triangles indicate upregulation, open rectangles indicate no change, and plus symbols indicate that expression of more than 3 genes is acquired for enzyme production. Abbreviations are addressed in the Additional file 3: Table S2, according to Teusink et al. [28].
Figure 5
Figure 5
Box plots displaying the absolute intensity of the first gene of the cps cluster 1 (lp_1177; A), the fab-operon (lp_1670; B), dak1A (lp_0166; C), cfa2 (lp_3174; D), and lp_0988 (E) of L. plantarum WCFS1 (wild type), NZ3410 (ΔctsR), NZ3425CM hrcA), and NZ3423CM ctsRΔhrcA) grown at 28°C or 40°C. Asterisk indicates that (part) of the loci are significant differentially expressed when compared to the strains growth at the other temperature.
Figure 6
Figure 6
Involvement of CtsR and HrcA in hydrogen peroxide resistance. A) Colony forming units of L. plantarum WCFS1 (wt, squares), NZ3410 (ΔctsR, diamonds), NZ3425CMhrcA, circles), and NZ3423CMctsRΔhrcA, triangles) cultures when subjected to 40 mM H2O2 exposure. As a control, the ΔctsRΔhrcA strain was taken for incubation in PBS without H2O2 (dashes). Lines indicate the fitted reparameterized Weibull model data. Data shown are representative for 3 independent experiments. B) Time to the first 4 log10 reductions (t4D) for the same strains as in panel A. The t4D-value is the parameter estimate obtained by fitting a reparameterized Weibull model through the data and average for the 4 experiments. Error bars represent the 95% confidence interval of the parameter estimate. Significant difference from the wt (p < 0.05) is indicated by *.

References

    1. Li H, Cao Y. Lactic acid bacterial cell factories for gamma-aminobutyric acid. Amino Acids. 2010;39(5):1107–1116. doi: 10.1007/s00726-010-0582-7. - DOI - PubMed
    1. Bourdichon F, Casaregola S, Farrokh C, Frisvad JC, Gerds ML, Hammes WP, Harnett J, Huys G, Laulund S, Ouwehand A. et al.Food fermentations: microorganisms with technological beneficial use. Int J Food Microbiol. 2012;154(3):87–97. doi: 10.1016/j.ijfoodmicro.2011.12.030. - DOI - PubMed
    1. Ahrne S, Nobaek S, Jeppsson B, Adlerberth I, Wold AE, Molin G. The normal Lactobacillus flora of healthy human rectal and oral mucosa. J Appl Microbiol. 1998;85(1):88–94. doi: 10.1046/j.1365-2672.1998.00480.x. - DOI - PubMed
    1. Lee NK, Yun CW, Kim SW, Chang HI, Kang CW, Paik HD. Screening of Lactobacilli derived from chicken feces and partial characterization of Lactobacillus acidophilus A12 as an animal probiotics. J Microbiol Biotechnol. 2008;18(2):338–342. - PubMed
    1. Siezen RJ, Tzeneva VA, Castioni A, Wels M, Phan HT, Rademaker JL, Starrenburg MJ, Kleerebezem M, Molenaar D, Van Hylckama Vlieg JE. Phenotypic and genomic diversity of Lactobacillus plantarum strains isolated from various environmental niches. Environ Microbiol. 2010;12(3):758–773. doi: 10.1111/j.1462-2920.2009.02119.x. - DOI - PubMed