. 2013 Dec 12;39(6):1032-42.
doi: 10.1016/j.immuni.2013.11.001. Epub 2013 Nov 14.

Crystal structure of Vδ1 T cell receptor in complex with CD1d-sulfatide shows MHC-like recognition of a self-lipid by human γδ T cells

Affiliations

Crystal structure of Vδ1 T cell receptor in complex with CD1d-sulfatide shows MHC-like recognition of a self-lipid by human γδ T cells

Adrienne M Luoma et al. Immunity. .

Abstract

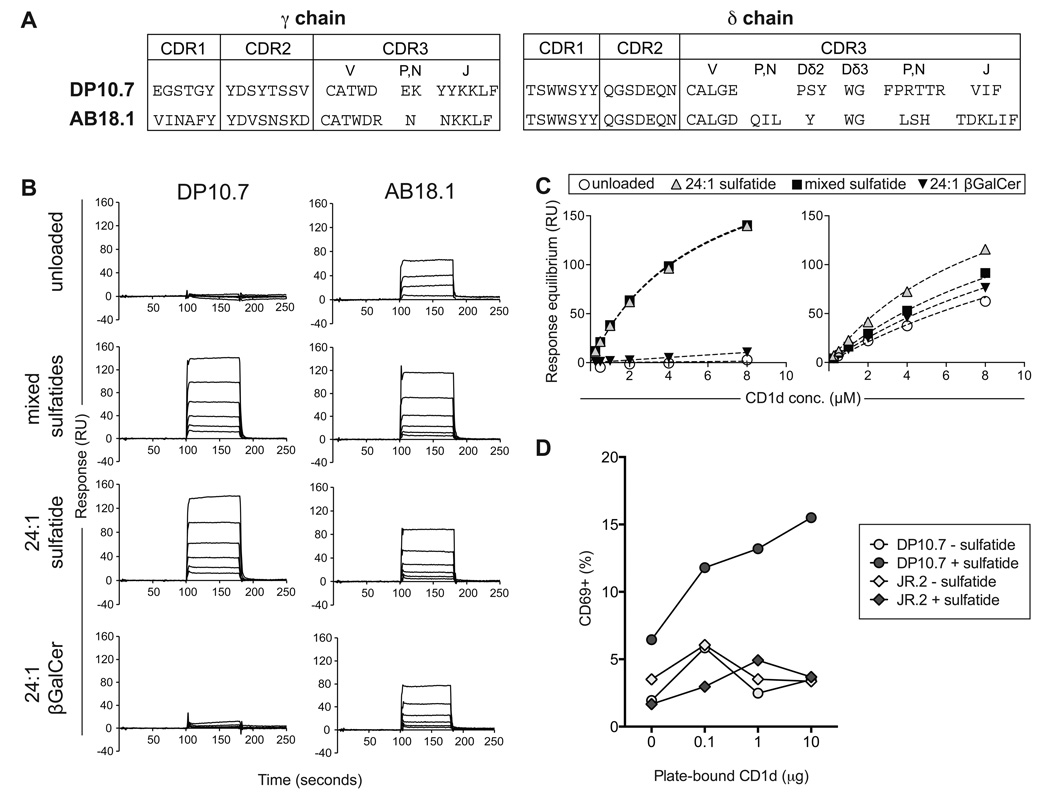
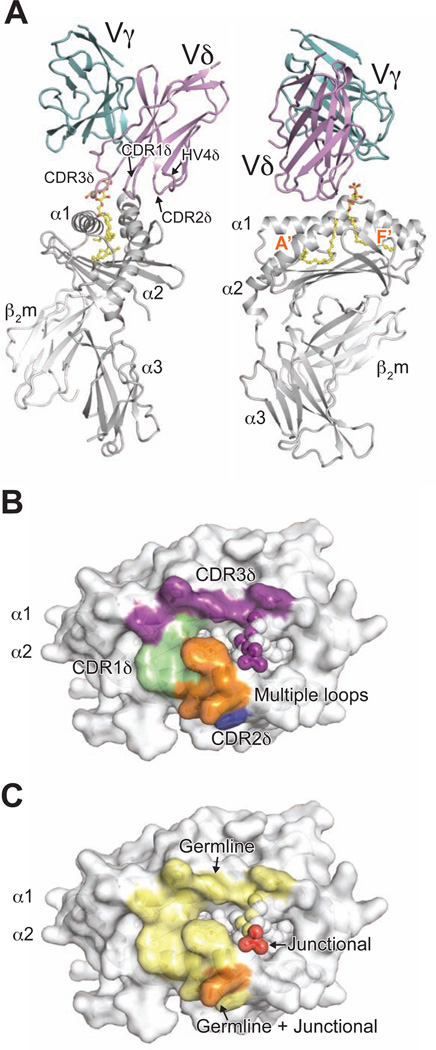
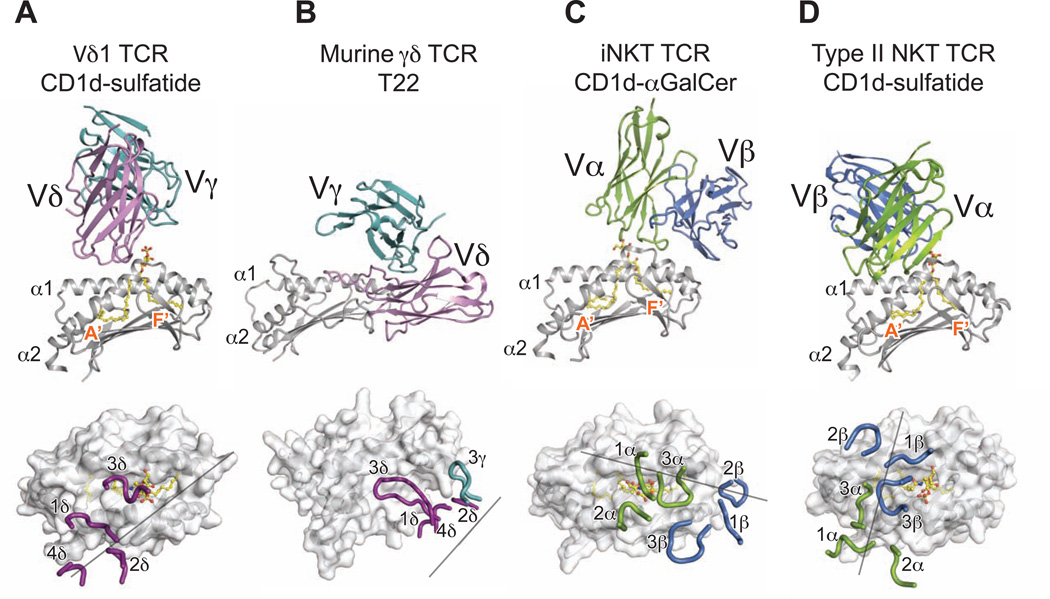
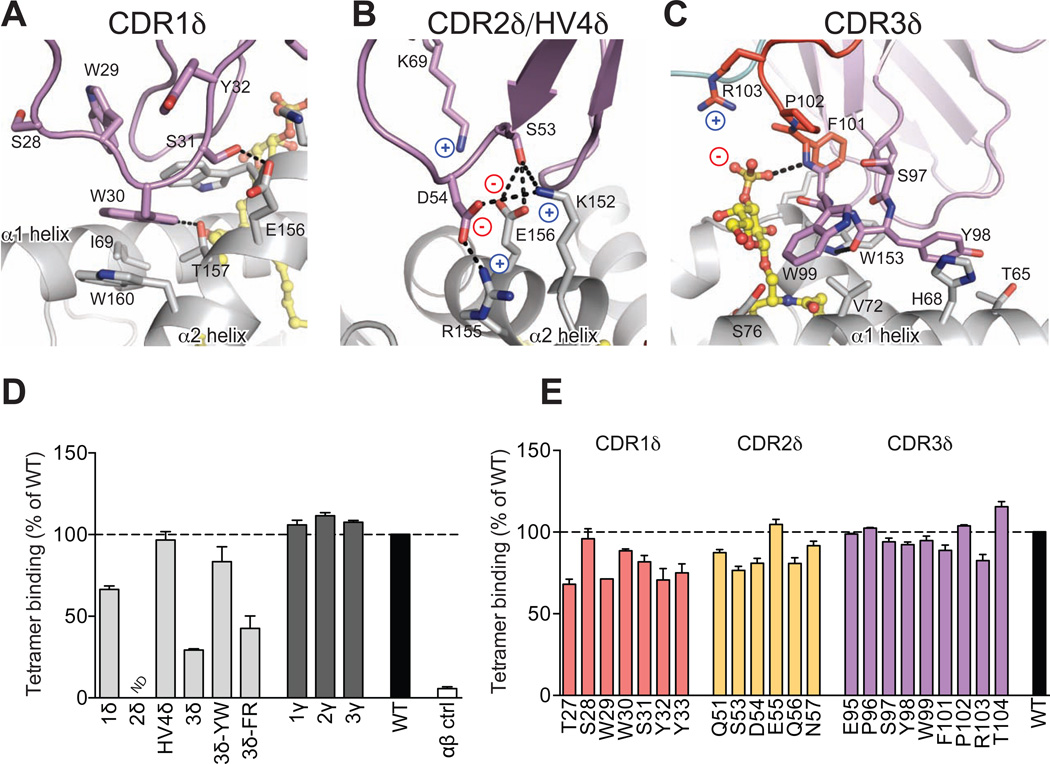
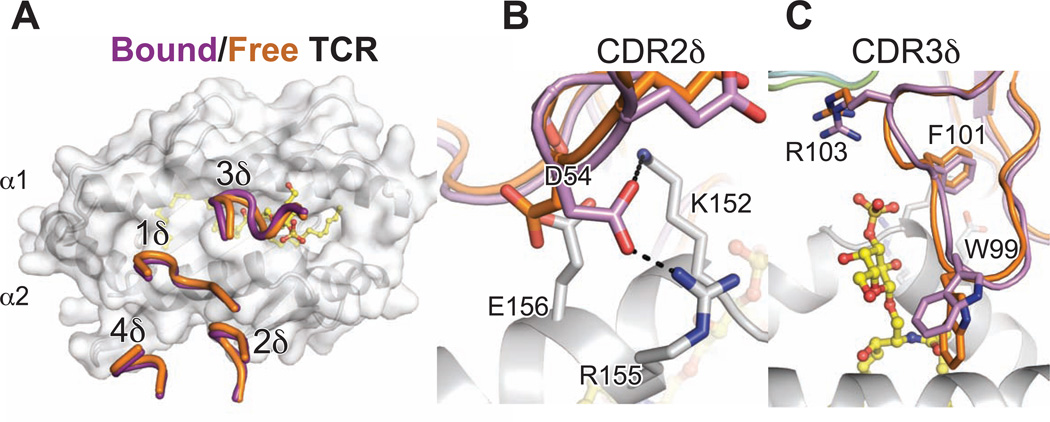
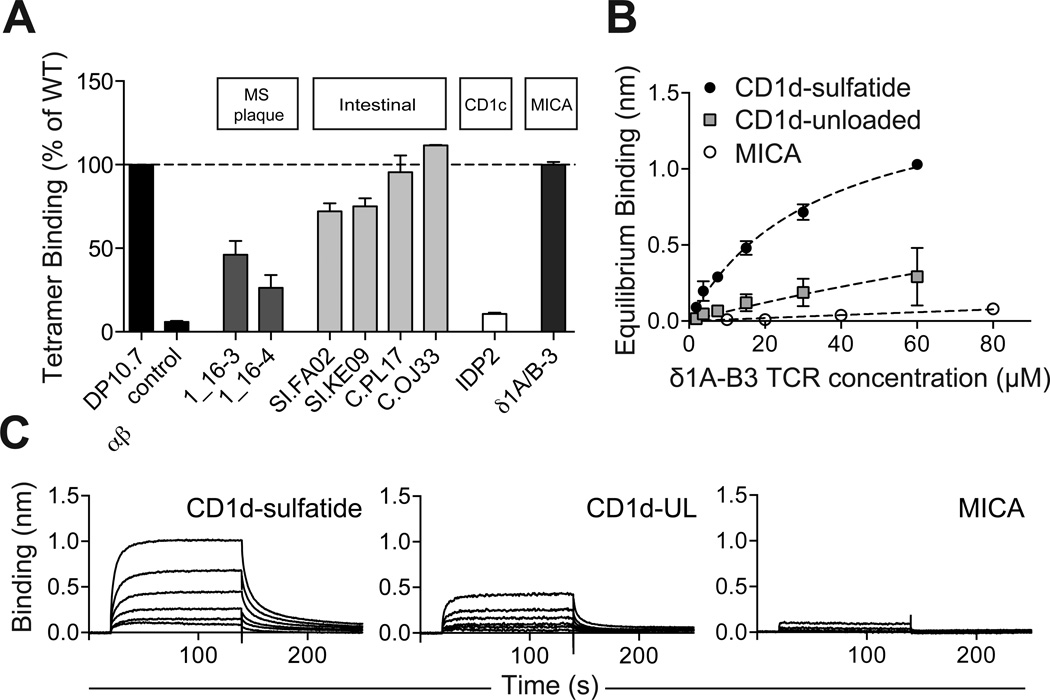
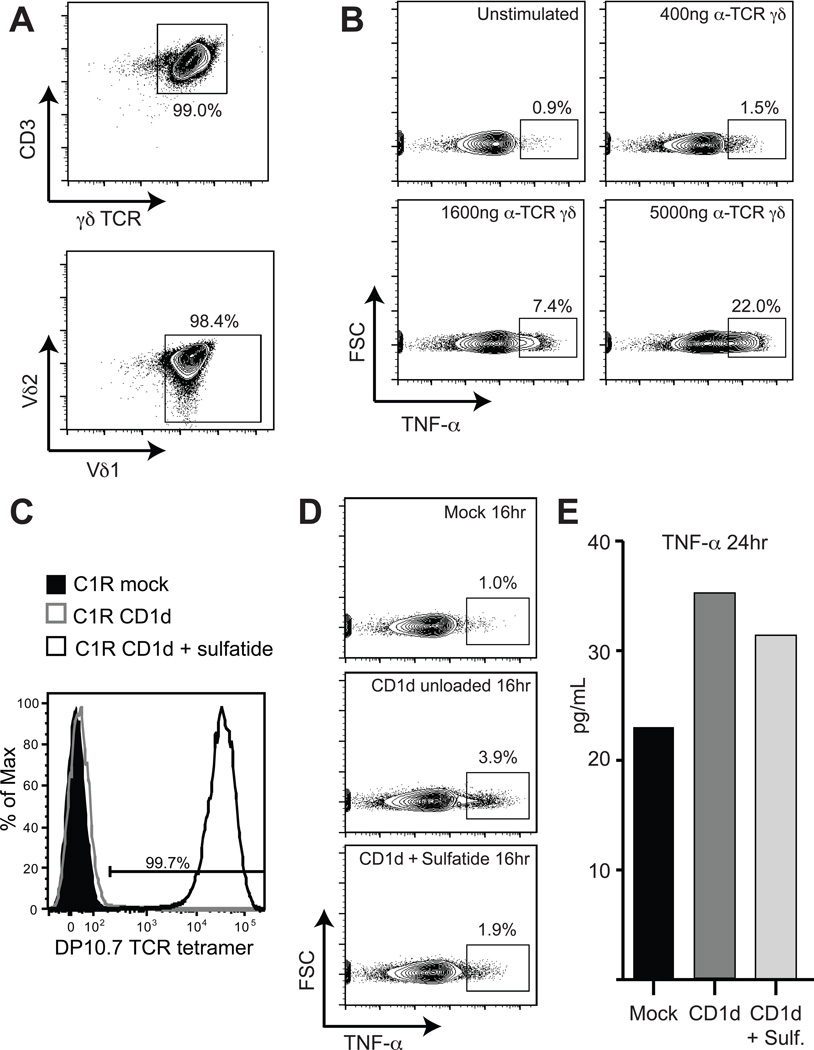
The nature of the antigens recognized by γδ T cells and their potential recognition of major histocompatibility complex (MHC)-like molecules has remained unclear. Members of the CD1 family of lipid-presenting molecules are suggested ligands for Vδ1 TCR-expressing γδ T cells, the major γδ lymphocyte population in epithelial tissues. We crystallized a Vδ1 TCR in complex with CD1d and the self-lipid sulfatide, revealing the unusual recognition of CD1d by germline Vδ1 residues spanning all complementarity-determining region (CDR) loops, as well as sulfatide recognition separately encoded by nongermline CDR3δ residues. Binding and functional analysis showed that CD1d presenting self-lipids, including sulfatide, was widely recognized by gut Vδ1+ γδ T cells. These findings provide structural demonstration of MHC-like recognition of a self-lipid by γδ T cells and reveal the prevalence of lipid recognition by innate-like T cell populations.


Figures

Figure 1
Figure 1. CD1d-sulfatide recognition by human Vδ1+ T cells is TCR-dependent
(A) CDR loop amino acid sequences of two CD1d-sulfatide-specific Vδ1 clones (DP10.7 and AB18.1). (B) Surface Plasmon Resonance (SPR) binding responses of CD1d purified with endogenous lipids “unloaded” or loaded with indicated sulfatide variants, to C-terminally biotinylated DP10.7 and AB18.1 TCRs immobilized on a streptavidin Biacore© chip. Response units of CD1d binding (0.25 – 8 µM) after reference channel subtraction are shown. (C) Equilibrium affinity analysis of DP10.7 and AB18.1 TCR binding to indicated CD1d forms. (D) Percent CD69 upregulation on DP10.7 TCR transduced Jurkat J.RT3-T3.5 T cells stimulated by plate-bound CD1d purified with endogenous lipids (white circles) or loaded with sulfatide (grey circles). A control JR.2 TCR, which is CD1c specific, was similarly transduced and stimulated with CD1d presenting endogenous lipids (white diamonds) or CD1d-sulfatide (grey diamonds) (see also Figure S1).
Figure 2
Figure 2. Complex structure of DP10.7 TCR and CD1d-sulfatide reveals exclusive δ chain dependence
Overview of DP10.7 TCR-CD1d-sulfatide complex and contacts. (A) CD1d heterodimer, light grey; sulfatide, yellow; DP10.7 TCR γ-chain and δ-chain, light teal and violet, respectively. Side view (left) of complex shows tilted TCR docking angle, which restricts CD1dsulfatide contacts to the δ chain. Front view (right) shows orientation of TCR over the CD1d A’ pocket. (B) Surface of CD1d-sulfatide is shown in white, and residues that contact the TCR are colored according to CDR loop (residues ≤ 4.0 Å from TCR). CD1d residues contacted by CDR1δ, CDR2δ and CDR3δ shown in green, marine blue, and purple, respectively. CD1d residues contacted by multiple CDR/HV4 shown in orange. Atoms of sulfatide contacted by CDR3δ shown as purple spheres. (C) Surface of CD1d-sulfatide is shown in white, and residues (CD1d) or atoms (sulfatide) that contact the TCR are colored according to germline, non-germline, or both origin in light yellow, red, and light orange, respectively (see also Figure S2 and Table S1).
Figure 3
Figure 3. The Vδ1 DP10.7 TCR employs a unique docking mode
View of TCR variable domains (top) in complex with α1,α 2 domains of ligands and CDR loop footprint/docking orientation (bottom) of TCR-ligand complexes. (A) Murine G8 γδ TCR-T22 complex (Protein Data Bank accession code 1YPZ) (B) Human iNKT TCR-CD1d-αGalCer complex (Protein Data Bank accession code 2PO6) (C) and Murine type II NKT TCR-CD1d-sulfatide complex (Protein Data Bank accession code 4EI5) (D). Surface of ligand α1,α2 domains shown in white; lipid ligands if present shown in yellow. TCR γ-chain shown in light teal, δ-chain in violet (A,B); TCR-α chain shown in green, β-chain in blue. (C,D) Grey lines represent vector connecting the conserved disulfide bond in each V domain (see also Table S2).
Figure 4
Figure 4. Analysis of DP10.7 TCR-CD1d-sulfatide contacts
(A–C) Polar contacts are shown in dashed black lines; charges are indicated to emphasize salt-bridge contacts. CD1d shown in light grey, sulfatide in yellow, TCR germline residues in violet, non-templated in red for CDR1δ (A); CDR2δ and HV4 (B); and CDR3δ (C) contacts. (D–E) TCR mutagenesis and binding measurements were determined by plate-binding assay. ELISA plate wells were coated with WT or mutant single-chain (sc) TCRs, and binding to CD1d-sulfatide-tetramers labeled with HRP was measured by colorimetric readout (A450). Non-specific binding to BSA was subtracted and binding was calculated as a % of WT. Shown are the mean and S.E.M. of at least two independent experiments. (D) Entire CDR loops were substituted with an unrelated CDR loop sequences and binding was compared with the WT DP10.7 TCR. Double-alanine mutations of indicted CDR3δ loop residues were also analyzed. (E) Single alanine point mutations of the DP10.7 TCR δ chain were made and binding vs WT TCR was measured as above (see also Figure S3 and Table S3).
Figure 5
Figure 5. Minimal conformation change required for CD1d-sulfatide recognition
(A) Overall structure of the un-liganded DP10.7 TCR. The native DP10.7 δ and γ variable domains were fused to human α and β constant domains, respectively to facilitate protein expression and crystallization. Overall structure is shown with CDR loops indicated. Electron density for the CDR1γ loop was discontinuous, and represented as dashed line to show backbone connectivity. (B) Free TCR (chain B, orange) was aligned to bound TCR (purple) shown with CD1d (light grey)-sulfatide (yellow) complex. δ chain CDR loops of free and bound TCR are shown over CD1d surface. (C,D) Side-chains of CDR2δ,3δ loops that make rearrangements upon ligation are highlighted (see also Figure S4).
Figure 6
Figure 6. Widespread recognition of CD1d-sulfatide by Vδ1+ T cells
(A) CD1d-sulfatide tetramer binding assay to plate-bound scTCRS. CD1d-sulfatide tetramers were labeled with HRP for colorimetric readout. Non-specific binding to BSA was subtracted and binding was calculated as a % of DP10.7 TCR. Shown are the mean and S.E.M. of at least two independent experiments. (B) BLI analysis of δ1A/B-3 sc TCR binding to immobilized CD1d-sulfatide, unloaded CD1d (CD1d-UL) or to MICA. TCR concentrations ranged from 1.88–60 µM (CD1d-sulfatide, CD1d-UL) or from 10–80 µM (MICA). Shown are representative data from one of two experiments. (C) Equilibrium affinity analysis of (B). Shown are the equilibrium binding mean and standard deviation from two experiments, as well as fits used to calculate Kd values (see also Figure S5).
Figure 7
Figure 7. Reactivity of gut Vδ1+ T cells to CD1d presenting endogenous lipids including sulfatide
(A) Flow cytometry contour plots showing CD3 and γδ TCR expression of a polyclonal Vδ1 IEL cell line (top) and Vδ1 versus Vδ2 TCR expression (bottom). (B) Flow cytometry contour plots of TNF-α intracellular-cytokine staining of a polyclonal Vδ1 IEL cell line stimulated with increasing concentrations of anti-γδ TCR antibody. The concentration of antibody used is indicated at the top of each plot and the percentages displayed indicate cells gated for TNF-α expression. (C) Flow cytometry histogram plot of DP10.7 TCR tetramer staining of C1R mock transfectant (shaded black), C1R-CD1d transfectant unloaded (grey line) or C1R-CD1d transfectant treated with 30 µg/ml sulfatide (black line). Percentage of tetramer positive cells is indicated above the drawn gate. (D) Flow cytometry contour plots of intracellular TNF-α staining after 16 hours of co-culture of a polyclonal Vδ1 IEL cell line with C1R mock transfectants (top), unloaded C1R-CD1d transfectants (middle) and C1R-CD1d transfectants loaded with sulfatide (bottom). (E) Bar graph showing TNF-α levels in the culture supernatant measured by ELISA after 24 hours of co-culture of a polyclonal Vδ1 IEL cell line with C1R-mock, C1R-CD1d unloaded and C1R-CD1d sulfatide transfectants.

Comment in

Similar articles

Cited by

References

    1. Adams EJ, Chien YH, Garcia KC. Structure of a gammadelta T cell receptor in complex with the nonclassical MHC T22. Science. 2005;308:227–231. - PubMed
    1. Adams EJ, Strop P, Shin S, Chien YH, Garcia KC. An autonomous CDR3delta is sufficient for recognition of the nonclassical MHC class I molecules T10 and T22 by gammadelta T cells. Nat Immunol. 2008;9:777–784. - PMC - PubMed
    1. Agea E, Russano A, Bistoni O, Mannucci R, Nicoletti I, Corazzi L, Postle AD, De Libero G, Porcelli SA, Spinozzi F. Human CD1-restricted T cell recognition of lipids from pollens. J Exp Med. 2005;202:295–308. - PMC - PubMed
    1. Bai L, Picard D, Anderson B, Chaudhary V, Luoma A, Jabri B, Adams EJ, Savage PB, Bendelac A. The majority of CD1d-sulfatide-specific T cells in human blood use a semiinvariant Vdelta1 TCR. Eur J Immunol. 2012;42:2505–2510. - PMC - PubMed
    1. Bauer S, Groh V, Wu J, Steinle A, Phillips JH, Lanier LL, Spies T. Activation of NK cells and T cells by NKG2D, a receptor for stress-inducible MICA. Science. 1999;285:727–729. - PubMed

Publication types

MeSH terms