. 2013 Dec 4;80(5):1232-45.
doi: 10.1016/j.neuron.2013.08.027. Epub 2013 Nov 14.

Dissecting local circuits: parvalbumin interneurons underlie broad feedback control of olfactory bulb output

Affiliations

Dissecting local circuits: parvalbumin interneurons underlie broad feedback control of olfactory bulb output

Kazunari Miyamichi et al. Neuron. .

Abstract

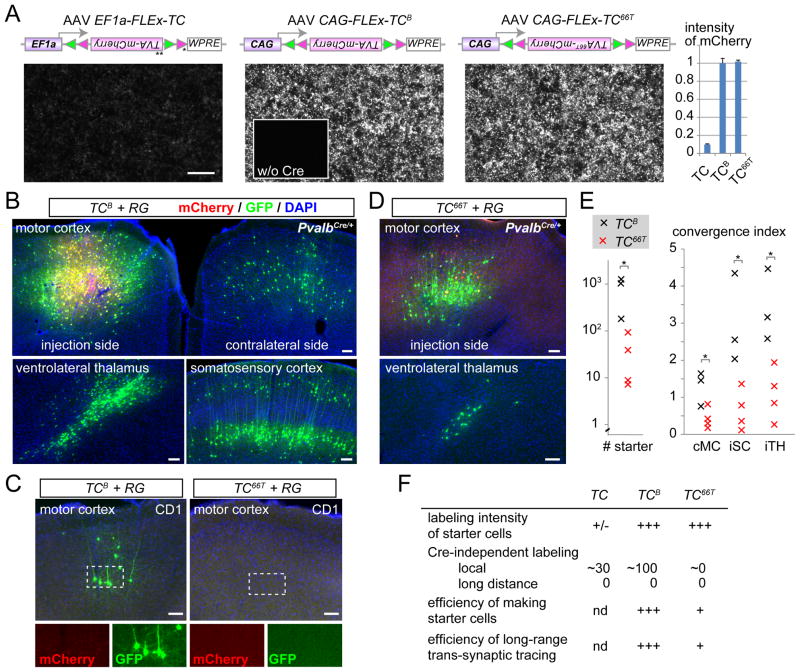
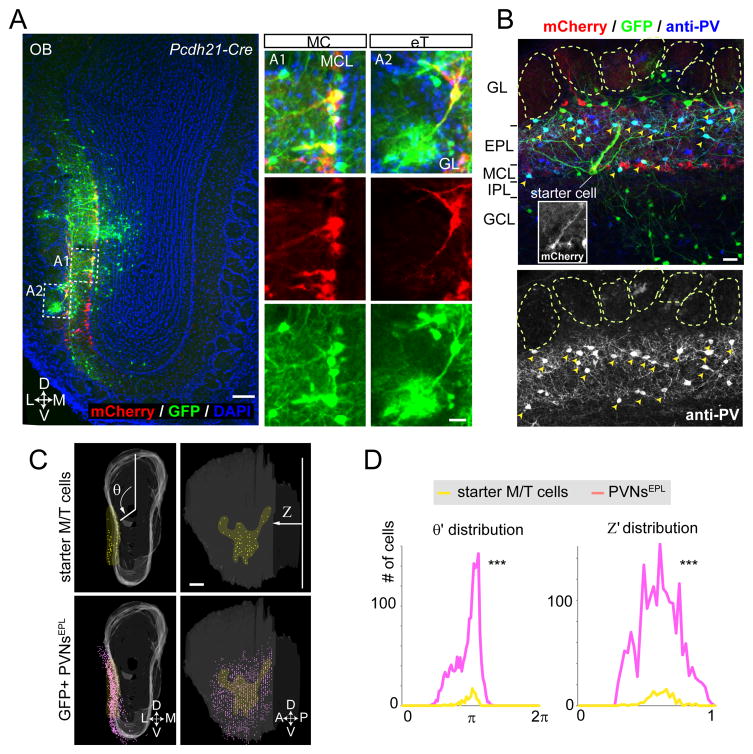
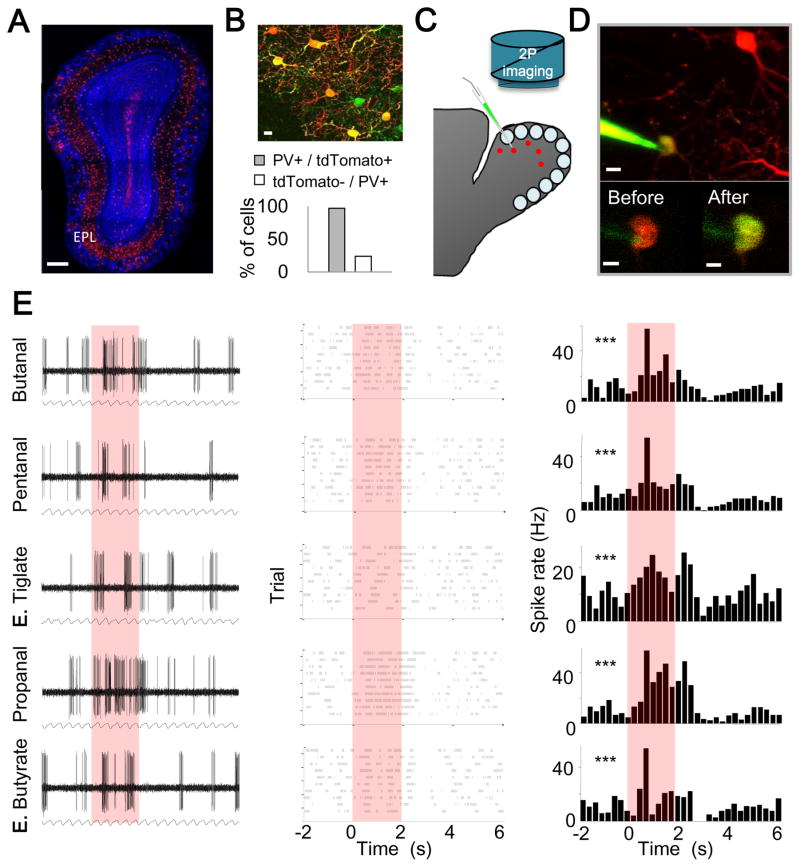
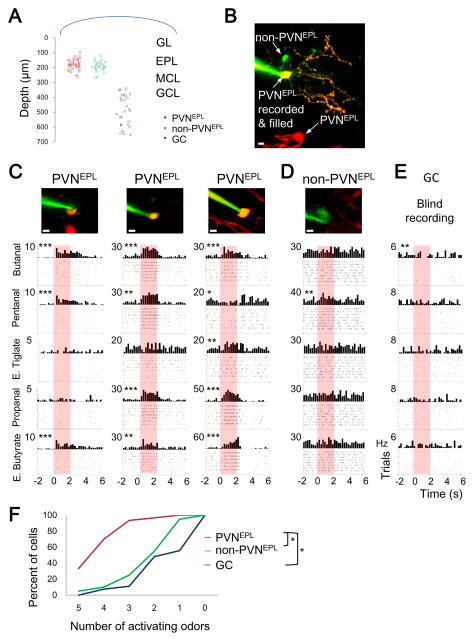
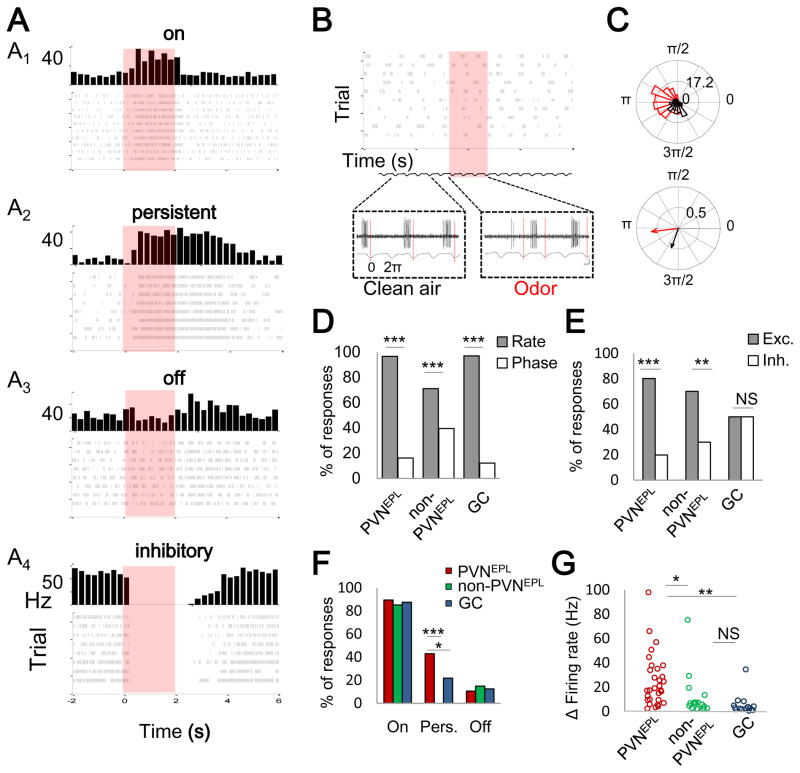
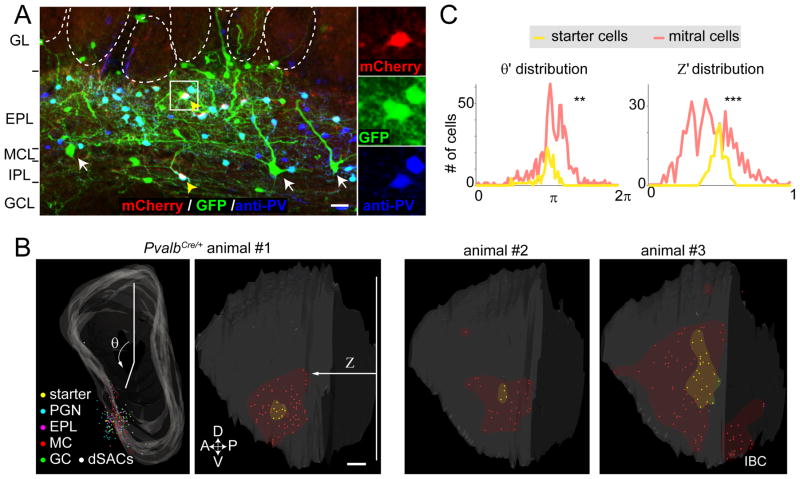
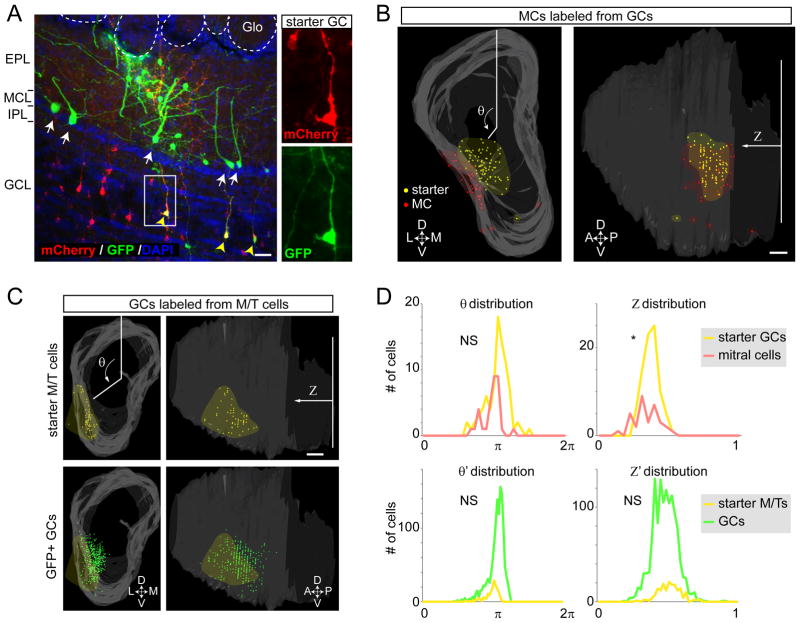
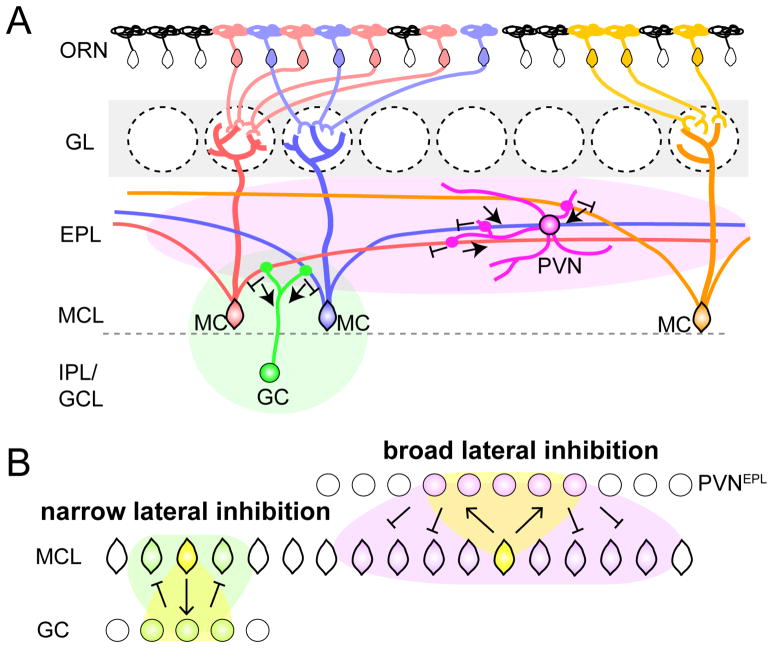
In the mouse olfactory bulb, information from sensory neurons is extensively processed by local interneurons before being transmitted to the olfactory cortex by mitral and tufted (M/T) cells. The precise function of these local networks remains elusive because of the vast heterogeneity of interneurons, their diverse physiological properties, and their complex synaptic connectivity. Here we identified the parvalbumin interneurons (PVNs) as a prominent component of the M/T presynaptic landscape by using an improved rabies-based transsynaptic tracing method for local circuits. In vivo two-photon-targeted patch recording revealed that PVNs have exceptionally broad olfactory receptive fields and exhibit largely excitatory and persistent odor responses. Transsynaptic tracing indicated that PVNs receive direct input from widely distributed M/T cells. Both the anatomical and functional extent of this M/T→PVN→M/T circuit contrasts with the narrowly confined M/T→granule cell→M/T circuit, suggesting that olfactory information is processed by multiple local circuits operating at distinct spatial scales.


Figures

Figure 1
Figure 1. Optimizing Cell Type-specific Trans-synaptic Tracing
(A) Schematic of the construct and DNA transfection in cultured HEK293 cells. To increase the expression level of Cre-dependent pEF1-FLEx-TC (Watabe-Uchida et al., 2012) (left), we changed the promoter to CAG, removed an upstream and out-of-frame ATG (*) between the promoter and the open reading frame after Cre mediated recombination, and added a Kozak sequence before the start codon (**) for optimal translation (Kozak, 1987). The resultant cassette (pCAG-FLEx-TCB, middle) was further modified by introducing a point mutation in TVA to construct pCAG-FLEx-TC66T (right). All constructs, when co-transfected with a CAG-Cre plasmid, allowed 293 cells to express mCherry, while mCherry was not expressed in the absence of Cre (middle inset and data not shown). mCherry expression level was markedly increased in CAG-FLEx-TCB and CAG-FLEx-TC66, as quantified in the right graph (mean ± SEM); mCherry intensity of CAG-FLEx-TCB is normalized to 1. (B) Proof-of-principle demonstration of Cre-dependent trans-synaptic tracing by transducing a mixture of two AAV2 vectors containing CAG-FLEx-RG and CAG-FLEx-TCB into the primary motor cortex (M1) of PvalbCre/+ mice, followed by RV-ΔG-GFP+EnvA. Starter cells (yellow) and AAV-transduced cells that did not receive RV (red) were restricted to the injection site, and trans-synaptically labeled GFP+ neurons (green) were found in presynaptic areas of the M1, including the contralateral M1 (cMC), ipsilateral somatosensory cortex (iSC), and ipsilateral ventrolateral thalamus (iTH). (C) Negative controls co-transducing AAV2 CAG-FLEx-TCB or CAG-FLEx-TC66T with AAV2 CAG-FLEx-RG into CD1 mice with no Cre expression. mCherry from AAV was rarely detected, but GFP from RV was detected near the injection site when CAG-FLEx-TCB was used. In contrast, no GFP or mCherry was detected when CAG-FLEx-TC66T was used. (D) A proof-of-principle demonstration of trans-synaptic tracing by transducing PvalbCre/+ mice with AAV2 CAG-FLEx-TC66T and AAV2 CAG-FLEx-RG. Similar to panel (B), starter cells in M1 and local and long-range presynaptic partners were detected. (E) Quantification of number of starter cells (left) and convergence index for long distance tracing. Each “x” represents an individual experiment with CAG-FLEx-TCB (black) or CAG-FLEx-TC66T (red). cMC, contralateral motor cortex; iSC, ipsilateral somatosensory cortex; iTH, ipsilateral thalamus. (F) Summary of three variants of trans-synaptic tracing. Scale bars, 100 μm. See Figure S1 for additional controls and quantification.
Figure 2
Figure 2. Parvalbumin Neurons in the External Plexiform Layer Are Prominent Presynaptic Partners of M/T Cells
(A) Starter cells were limited to the mitral and tufted cell populations by transducing Pcdh21-Cre mice with AAV2 CAG-FLEx-RG and AAV2 CAG-FLEx-TC66T followed by RV-ΔG-GFP+EnvA. In this 60-μm coronal section, starter cells are located in the mitral cell layer (MCL) and the boundary between glomeruli and external plexiform layer (eT, for external tufted cells). L, lateral; M, medial; D, dorsal; V, ventral. Scale bars, 100 μm for the low magnification image; 20 μm for the high magnification images. (B) A typical example of a 60-μm coronal section containing a starter MC (inset) and GFP+ presynaptic neurons stained by anti-PV antibodies. GL, glomerular layer; EPL, external plexiform layer; MCL, mitral cell layer; IPL, internal plexiform layer; GCL, granule cell layer. Neurons co-labeled with GFP and anti-PV antibodies are indicated by yellow arrowheads. Scale bar, 20 μm. (C) A representative example of 3D-reconstructed OB showing starter M/T cell populations (yellow dots) and GFP+ PVNsEPL (magenta dots). White shadow represents the 2D surface of the MCL in the 3D OB model. θ represents rotation angle from the polar axis (vertical line in the left top panel), and Z represents the relative distance from the most posterior section. A, anterior; P, posterior. Scale bar, 200 μm. (D) Histograms showing distribution of normalized θ and Z (θ′ and Z′) for pooled data (n=3 mice). Notably, both θ′ and Z′ distribution of PVNsEPL was significantly broader than those of starter cells. Statistical significance was tested by the Levene’s test against the null hypothesis assuming the equal variance between two populations (*** p<0.001). See Figure S2 for 3D-reconstruction of labeled OB samples; Figure S3 for tracing with a longer survival period after RV infection; Figure S6 for cortical feedback input to M/T cells.
Figure 3
Figure 3. Two Photon Targeted Recording of OB PVNs in vivo
(A) A confocal micrograph of an OB coronal section from a PvalbCre/+; Rosa26Ai9/+ mouse, showing conditional expression of tdTomato in PVNs (red). EPL, external plexiform layer. Scale bar, 250 μm. (B) Top, a merged imaged of PV immunostaining (green) and tdTomato expression (red). Yellow cells denote double labeling. Scale bar, 15 μm. Bottom, in the EPL, P(PV+/tdTomato+) is 97.2%, and P(tdTomato-/PV+) is 24.0% (n= 280 cells from 2 mice). Based on our estimate that 1/3 of EPL cells are PV+ (Figure S1D), we infer using Bayes’ Rule that P(PV+/tdTomato-) is ~11%. (C) Schematic of two-photon targeted patch (TPTP) recording from PV+ neurons. (D) Top, a two-photon micrograph showing an in vivo TPTP recording from a PV+ neuron. Scale bar, 10 μm. Bottom, Two-photon micrograph of the cell body before (left) and after recording (right). Yellow somata denote successful labeling. Scale bar, 5 μm. (E) Representative example of a loose patch recording from a PVNEPL presented with 5 odors. Each row represents the responses to a single odor; red box indicates odor presentation (2 sec). Left, raw voltage traces showing spontaneous and odor evoked activity during one trial. The respiration trace is shown below. Middle, raster plots showing spontaneous and odor evoked activity across all trials. Right, peri-stimulus time histogram (PSTH) showing average spike rates across trials (binning 250 msec). Asterisks mark significant responses (paired T-test; ***p<0.001). See Figure 4 for spontaneous electriphysiological properties of PVNEPL.
Figure 4
Figure 4. PVNs Are Broadly Tuned to Odors
(A) Distribution of the depth of recording of all neurons in our dataset. (B) A two-photon micrograph of a non-recorded PVNEPL (tdTomato only, red), PVNEPL that was recorded from (TdTomato and dye, yellow) and a non-PVNEPL (dye only, green). Scale bar 10μm. (C–E) Neuronal responses from (C) three PVNEPL, (D) one non-PVNEPL (E) and one granule cell (GC). PSTHs and raster plots showing odor evoked responses (or lack thereof) to 5 odors. Asterisks mark significant responses *, P<0.05; **, P<0.01; ***, P<0.001 (paired T-test). The two photon micrograph of the recorded neuron is shown above. Scale bar 10 μm. (F) Cumulative distribution plot of odor selectivity in response to 5 odors for PVNEPL (n=30 neurons, red), non-PVNEPL (n=20 neurons, green) and GCs (n=27 neurons, blue). Tukey’s HSD; *, p<0.05.
Figure 5
Figure 5. Odor Response Profiles of PVNs Are Predominantly Excitatory
(A) Examples (PSTHs and raster plots) of four types of responses in PVNEPL neurons: on (A1); persistent (A2); off (A3); and inhibitory (A4). Each panel is a different cell and odor pair. (B) An example of an odor evoked response by phase tuning in a PVNEPL neuron. Top, raster plot for a single odor (8 trials). Bottom, raw spiking traces with regard to the respiration before and during odor presentation. (C) Phase-analysis of the cell shown in panel (B). Top, binned data of spike respiration phase tuning across all trials before and during odor presentation (black and red, respectively). Bottom, direction and magnitude of the mean resultant phase tuning vector before and during odor stimulation. (D) Histogram of odor evoked changes in firing rate and odor evoked changes in phase tuning for all cell groups (Binomial proportion test; p<0.001). (E) Histogram of odor evoked excitatory vs. inhibitory responses for each group (Binomial proportion test; p<0.01) (F) Histogram of the percentage of on, persistent (pers.) and off odor evoked responses for each group (Binomial proportion test; p<0.05). (G) Response magnitude of odor evoked changes in firing rate for each group (Tukey’s HSD, P<0.05). In panel (D–G), *, P<0.05; **-P<0.01; ***, P<0.001. NS, not significant. See Figure S5 for distribution of cells that exhibit excitatory, inhibitory, or both excitatory and inhibitory responses among PVNsEPL, non-PVNsEPL, and GCs.
Figure 6
Figure 6. The Presynaptic Landscape of PVNs Includes Widely Distributed MCs
(A) A representative 60-μm coronal section with starter cells co-stained with anti-PV antibodies. In this section, two PV+ starter cells were detected, one each in the EPL and IPL (yellow arrowheads). White arrows represent mitral cells. Abbreviations as in Figure 2B. Scale bar, 20 μm. (B) Three representative examples of 3D-reconstructed OBs showing starter PVNs (yellow dots) and GFP+ presynaptic neurons in the frontal (animal #1, left) and lateral (the rest) views. Different cell type/layer is represented by differently colored dots. Area of starter cells and MCs are highlighted by yellow and red shadows. θ and Z are as Figure 2. Note that some samples (for example, animal #3) contain labeled MCs in the mirror imaged area of the injection site (IBC, intra-bulbar connections) (Schoenfeld et al., 1985). Scale bar, 200 μm. (C) Histograms showing distribution of normalized θ and Z (θ′ and Z′) for pooled data (n=7 mice). Notably, both θ′ and Z′ distribution of presynaptically labeled MCs are significantly broader than those of starter cells. **, p<0.01 and ***, p<0.001 by the Levene’s test against the null hypothesis assuming the equal variance between two populations. See Figure S6 for cortical feedback input to PVNs.
Figure 7
Figure 7. Mitral Cell-Granule Cell Reciprocal Connections Are Narrowly Organized
(A) A representative 60-μm coronal section with starter cells in the granule cell population (yellow arrowheads). Trans-synaptically labeled MCs (white arrows) and EPL neurons were labeled with GFP. Abbreviations as in Figure 2B. Scale bar, 20 μm (B) A representative example of 3D-reconstructed OB showing starter GCs (yellow dots) and GFP+ presynaptic MCs (red dots) in the frontal (left panel) and lateral (right panel) views. Area of starter cells and MCs are highlighted by yellow and red shadows. θ and Z are as Figure 2. Scale bar, 200 μm. (C) A representative example of 3D-reconstructed OB showing starter mitral/tufted (M/T) cells (yellow dots) and GFP+ presynaptic GCs (green dots) in the frontal (left panels) and lateral (right panels) views. Areas of starter M/T cells are highlighted by yellow shadows. Scale bar, 200 μm. (D) Top: histograms showing distribution of θ and Z for the sample shown in the panel B. The variance of θ for the starter granule cells and presynaptic MCs are not significantly different (NS), while the variance of Z is significantly different (p<0.05). Bottom panels: histograms showing distribution of normalized and pooled θ and Z (θ′ and Z′) for the n=4 samples of condition shown in the panel C. The variance of θ′ and Z′ for the starter mitral/tufted (M/T) cells and presynaptic granule cell (GCs) are not significantly different (NS) by the Levene’s test.
Figure 8
Figure 8. Feedback Circuits by PVNsEPL Underlying Broad Odor Processing
(A) Schematic summary of the MC→PVNEPL→MC circuit in the OB. Each PVNEPL receives input from, and sends output to, broadly distributed MCs via MCs’ long secondary dendrites in the EPL for broad lateral inhibition of MC output. In contrast, the MC→GC→MC feedback circuit connects nearby MCs for local lateral inhibition. The green and magenta ovals symbolize areas influenced by PVN and GC. (B) Schematic illustration of the difference in the spatial spread of the two lateral inhibitory feedback loops.

Comment in

References

    1. Aungst JL, Heyward PM, Puche AC, Karnup SV, Hayar A, Szabo G, Shipley MT. Centre-surround inhibition among olfactory bulb glomeruli. Nature. 2003;426:623–629. - PubMed
    1. Batista-Brito R, Close J, Machold R, Fishell G. The distinct temporal origins of olfactory bulb interneuron subtypes. J Neurosci. 2008;28:3966–3975. - PMC - PubMed
    1. Cleland TA. Early transformations in odor representation. Trends Neurosci. 2010;33:130–139. - PMC - PubMed
    1. Cruikshank SJ, Lewis TJ, Connors BW. Synaptic basis for intense thalamocortical activation of feedforward inhibitory cells in neocortex. Nat Neurosci. 2007;10:462–468. - PubMed
    1. Davison IG, Katz LC. Sparse and selective odor coding by mitral/tufted neurons in the main olfactory bulb. J Neurosci. 2007;27:2091–2101. - PMC - PubMed

Publication types

MeSH terms