. 2013 Dec 12;52(5):617-28.
doi: 10.1016/j.molcel.2013.10.014. Epub 2013 Nov 14.

A bacterial toxin inhibits DNA replication elongation through a direct interaction with the β sliding clamp

Affiliations

A bacterial toxin inhibits DNA replication elongation through a direct interaction with the β sliding clamp

Christopher D Aakre et al. Mol Cell. .

Abstract

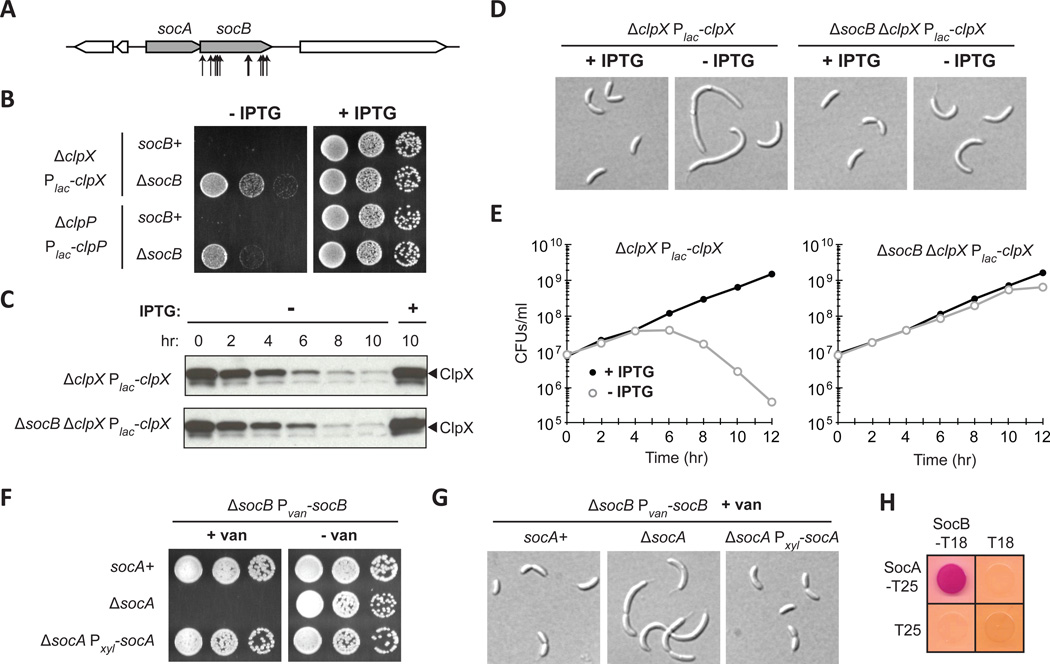
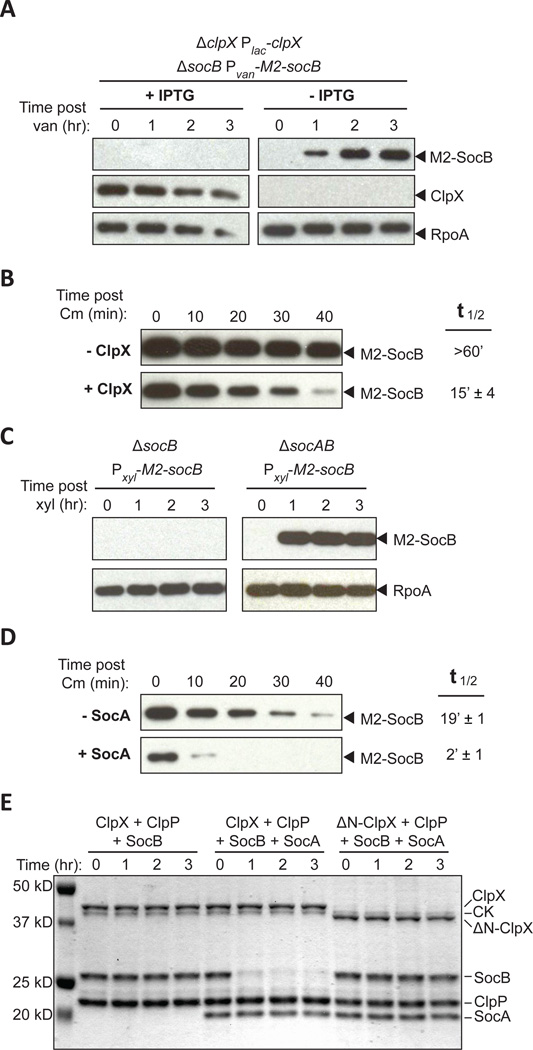
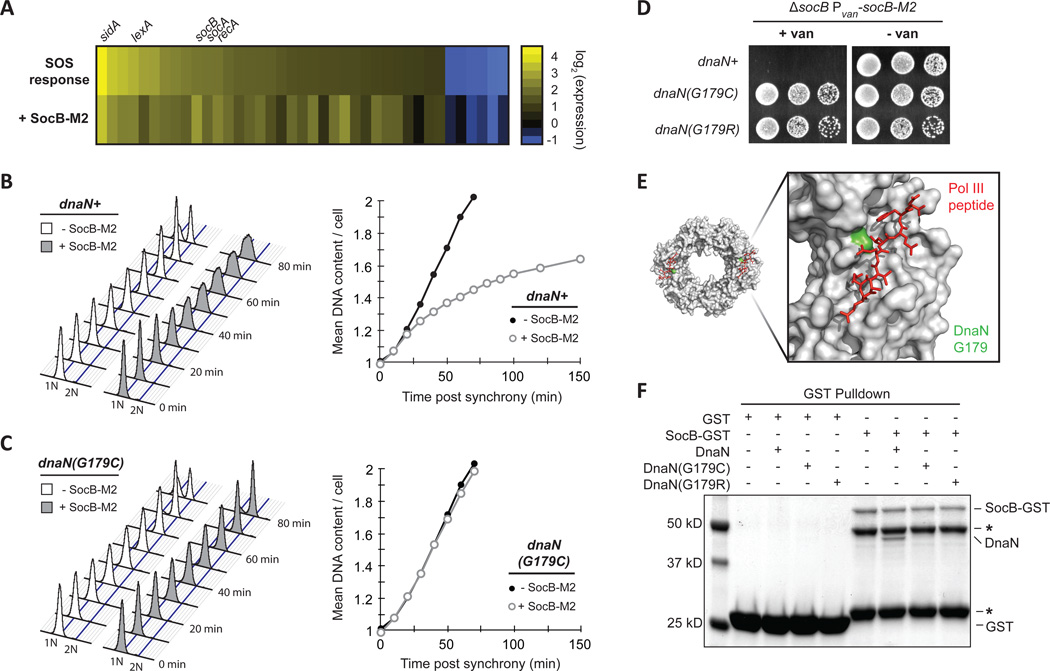
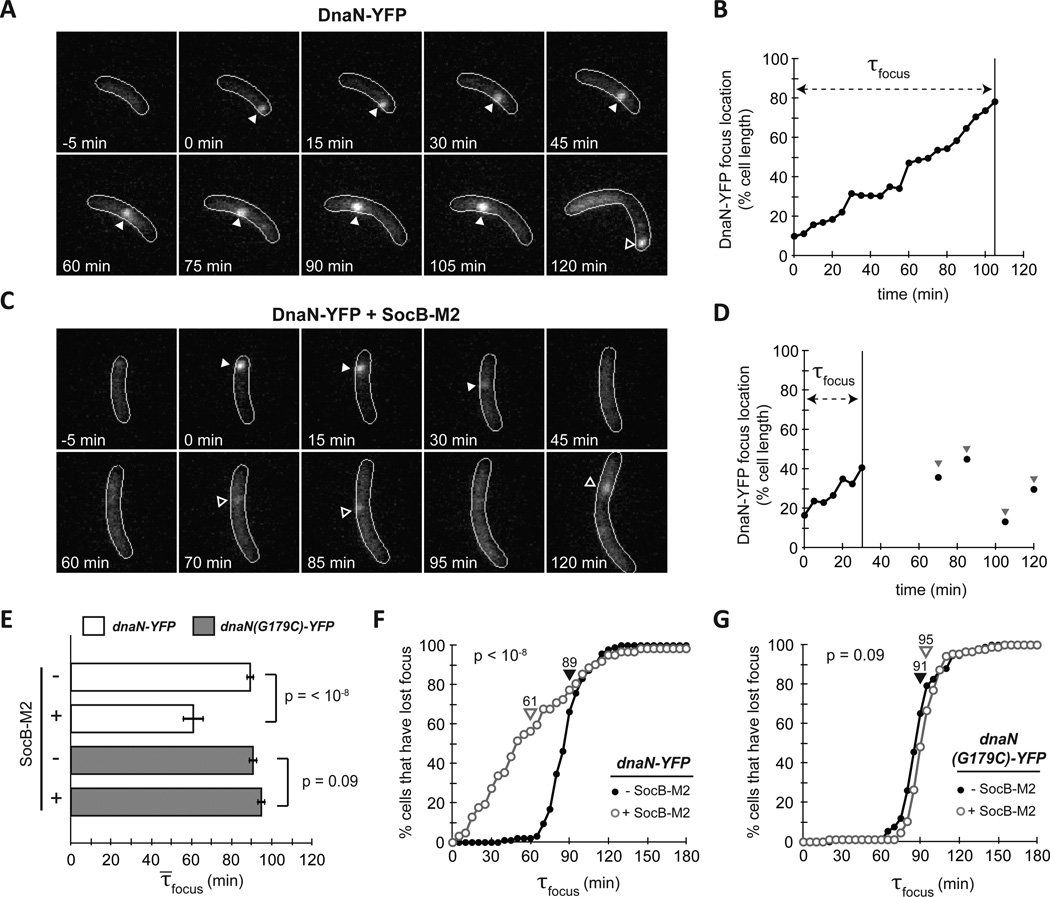
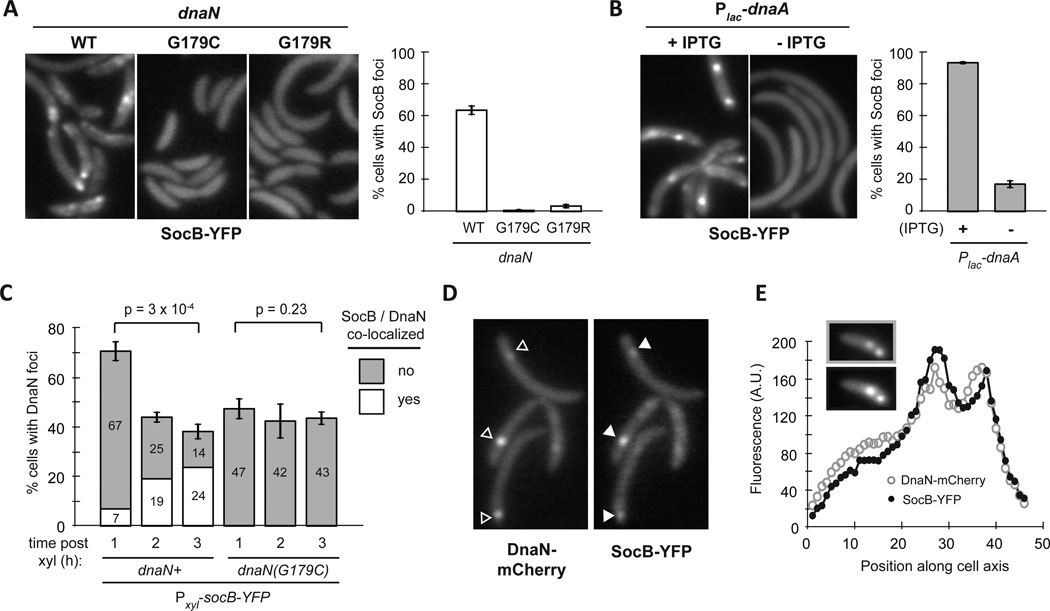
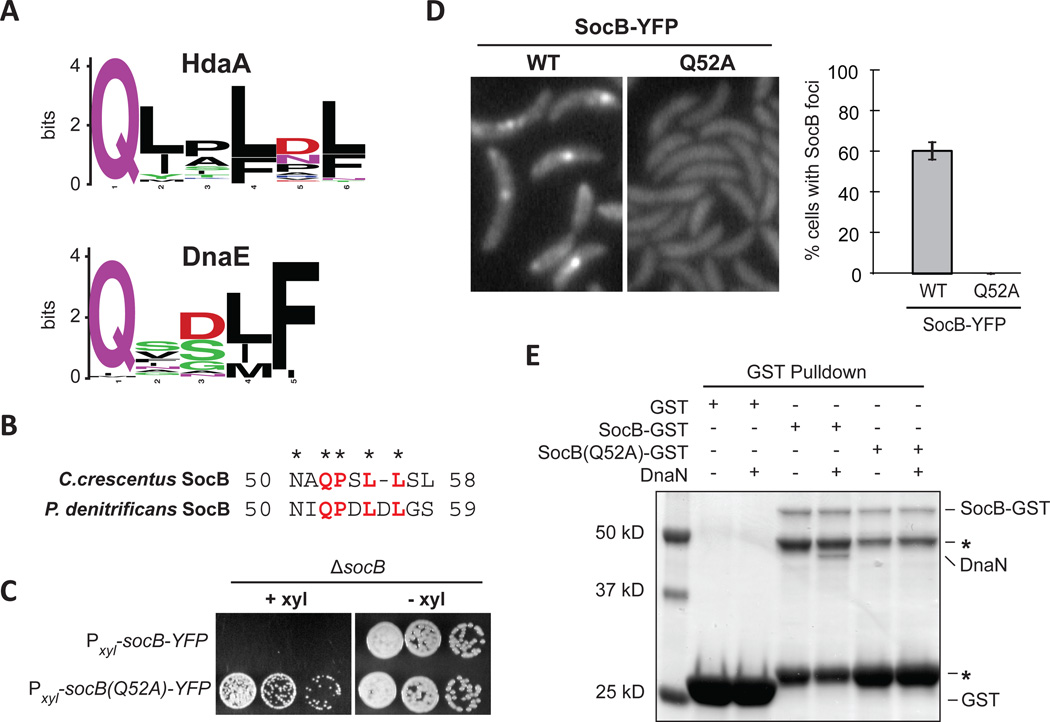
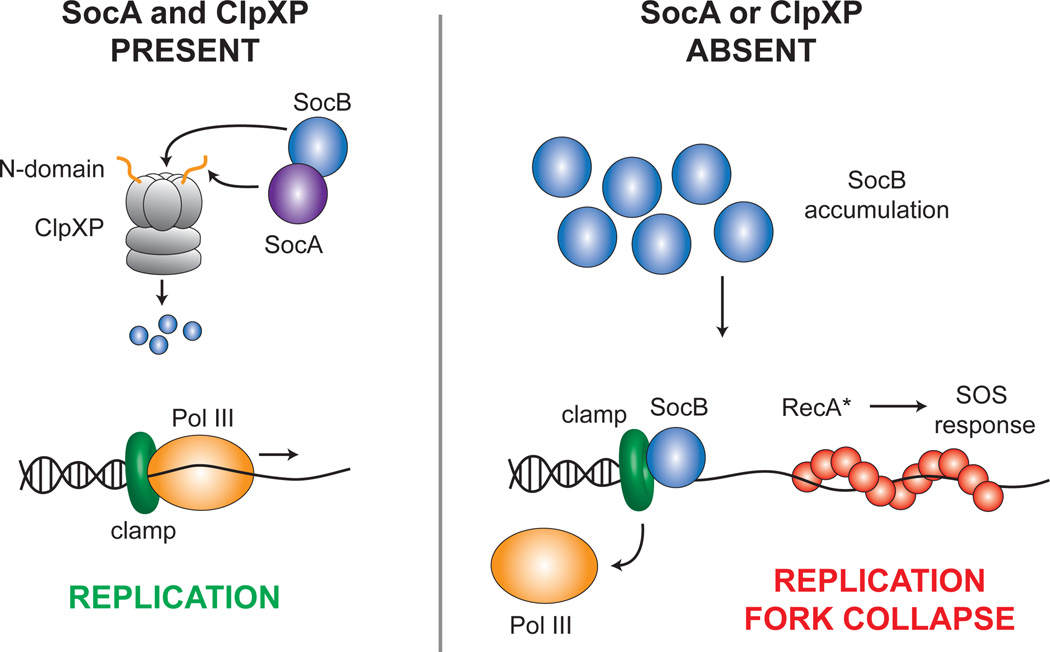
Toxin-antitoxin (TA) systems are ubiquitous on bacterial chromosomes, yet the mechanisms regulating their activity and the molecular targets of toxins remain incompletely defined. Here, we identify SocAB, an atypical TA system in Caulobacter crescentus. Unlike canonical TA systems, the toxin SocB is unstable and constitutively degraded by the protease ClpXP; this degradation requires the antitoxin, SocA, as a proteolytic adaptor. We find that the toxin, SocB, blocks replication elongation through an interaction with the sliding clamp, driving replication fork collapse. Mutations that suppress SocB toxicity map to either the hydrophobic cleft on the clamp that binds DNA polymerase III or a clamp-binding motif in SocB. Our findings suggest that SocB disrupts replication by outcompeting other clamp-binding proteins. Collectively, our results expand the diversity of mechanisms employed by TA systems to regulate toxin activity and inhibit bacterial growth, and they suggest that inhibiting clamp function may be a generalizable antibacterial strategy.


Figures

Fig. 1
Fig. 1. Mutations in the Toxin socB Bypass ClpXP Essentiality
(A) Schematic of transposon insertions in socB (CCNA_03629) that suppressed the essentiality of clpP. (B) Growth of clpX and clpP depletion strains in socB+ and ΔsocB backgrounds. Five-fold serial dilutions of the indicated strains were spotted onto media ± IPTG. (C) Kinetics of ClpX depletion. Indicated strains were shifted to media ± IPTG, and samples were subjected to immunoblotting. (D) Morphology of cells following ClpX depletion in socB+ and ΔsocB backgrounds. Strains from (C) were imaged by DIC microscopy at 10 hr. (E) Viability of cells following ClpX depletion in socB+ and ΔsocB backgrounds. Colony forming units (CFUs)/ml of the strains from (C) are shown; mean of two biological replicates. (F) Growth of strains expressing socB in the socA+ or ΔsocA backgrounds. The indicated strains were five-fold serially diluted onto media that induces or represses socB. (G) Morphology of strains from (F). The indicated strains were grown for 4 hr in socB inducing conditions and then imaged by DIC microscopy. (H) Bacterial two-hybrid analysis of the interaction between SocA and SocB. T18/T25 were included as a negative control; red indicates a positive interaction. Cells were grown for 1 day at 30°C. See also Fig. S1.
Fig. 2
Fig. 2. SocA Promotes SocB Degradation by ClpXP
(A) Abundance of M2-SocB ± ClpX assessed by immunoblotting. The indicated strain was grown in clpX inducing or repressing conditions for 12 hr and M2-socB expression was induced at time zero. RpoA is a loading control. (B) Stability of M2-SocB ± ClpX. clpX expression was repressed or induced for 12 hr, and then M2-socB expression was induced for 30 min prior to chloramphenicol (Cm) addition at time zero to shut off protein synthesis. Half-life ± S.E.M. quantified from three replicates (see Fig. S2A). (C) Abundance of M2-SocB ± SocA assessed by immunoblotting. M2-socB expression was induced at time zero. (D) Stability of M2-SocB ± SocA. M2-socB expression was induced for 2 hr, and then socA expression was induced for an additional 40 min prior to Cm addition at time zero. Half-life ± S.E.M. quantified from three replicates (see Fig. S2B). (E) In vitro degradation of SocB by ClpXP ± SocA. Amounts were: 0.5 µM ClpX or ΔN-ClpX, 1 µM ClpP, 5 µM SocB, 5 µM SocA, 32 µg/ml creatine kinase (CK), 16 mM creatine phosphate, and 4 mM ATP. Reaction performed at 4°C. See also Fig. S2.
Fig. 3
Fig. 3. SocB Blocks Replication Elongation Through an Interaction with DnaN
(A) Analysis of gene expression changes following exposure to the DNA-damaging agent mitomycin C for 30 min (SOS response, top row) or following socB-M2 expression for 2 hr (+SocB-M2, bottom row). For each treatment, the genes induced or repressed more than 2-fold following mitomycin C treatment are shown. (B) Flow cytometry of DNA content from synchronized cells grown ± socB-M2 expression. For the +SocB-M2 condition, socB-M2 was induced for 90 min prior to synchrony and release. Quantification of DNA content is shown on right. (C) Same as (B), except performed with the dnaN(G179C) strain. (D) Growth of indicated strains on socB-M2 inducing or repressing medium. Five-fold serial dilutions are shown. (E) Structure of the E. coli sliding clamp in complex with a peptide derived from Pol III (PDB: 3D1F). Pol III peptide is in red, and the E. coli residue that corresponds to G179 in Caulobacter is colored in green. (F) Interaction between SocB-GST and DnaN. For each condition, the indicated proteins were mixed with glutathione sepharose beads, washed, eluted, and then loaded on an SDS-PAGE gel. SocB-GST protein is unstable; asterisks indicate truncated SocB-GST products that retain GST tag. See also Fig. S3.
Fig. 4
Fig. 4. SocB Induces Replication Fork Collapse
(A) Fluorescence microscopy of strain bearing dnaN-YFP on a low-copy plasmid. dnaN-YFP was pre-induced for 2 h, and cells were synchronized and imaged every 5 min. Filled arrows indicates calculated position of DnaN-YFP focus; hollow arrows indicate a new round of replication following division. (B) Calculated DnaN-YFP focus position of the cell from (A). τfocus is calculated as the time from focus formation to loss. (C–D) Same as (A–B), except socB-M2 expression was induced for 90 min prior to synchrony and following release. Note the pre-mature focus loss between 30 and 45 min. Hollow arrows indicate transient DnaN-YFP focus formation events that may be attempts at replication restart. (E) Average τ̄focus for dnaN-YFP strain (white bars) and dnaN(G179C)-YFP strain (grey bars) ± socB-M2 expression. Error bars indicate ± S.E.M; n≥60 cells per condition. (F) Percentage of cells that have lost their DnaN-YFP focus as a function of time post initiation in the absence (filled circles) or presence (hollow circles) of socB-M2 expression. Average τ̄focus denoted by arrows. n≥60 cells per condition. (G) Same as (F), but with dnaN(G179C)-YFP strain. n≥60 cells per condition.
Fig. 5
Fig. 5. SocB Forms Foci that Co-Localize with DnaN
(A) Fluorescence microscopy of indicated strains at 3 hr post socB-YFP induction. Percentage of cells containing SocB-YFP foci is shown on the right. Errors bars indicate mean ± S.D. for three biological replicates (n>400 cells per replicate). (B) Fluorescence microscopy of Plac-dnaA cells grown in the presence or absence of IPTG for 2 hr prior to socB-YFP induction for 3 h. Percentage of cells containing SocB-YFP foci calculated as in (A). Errors bars indicate mean ± S.D. for three biological replicates (n>400 cells per replicate). (C) Percentage of cells with DnaN-mCherry foci as a function of time post socB-YFP induction. The percentage of total cells with co-localized (white) or not co-localized (grey) DnaN-mCherry and SocB-YFP foci is shown within each bar. Error bars indicate mean ± S.D. for three biological replicates (n>500 cells per replicate). (D) Co-localization of DnaN-mCherry foci (hollow arrows) and SocB-YFP foci (filled arrows) after induction of socB-YFP for 3 h. (E) Co-localization of multiple DnaN-mCherry and SocB-YFP foci in a single cell. Fluorescence profile for DnaN-mCherry (top inset, grey hollow circles) and SocB-YFP (bottom inset, black filled circles) is shown. See also Fig. S4.
Fig. 6
Fig. 6. SocB Interacts with DnaN Through a Conserved Motif
(A) Sequence logo of the DnaN-binding motif in HdaA or DnaE from α-proteobacteria. (B) Putative DnaN-binding motif in SocB from C. crescentus and P. denitrificans. (C) Growth of indicated strains on media that induces (+xyl) or represses (−xyl) socB-YFP or socB(Q52A)-YFP expression. Five-fold serial dilutions are shown. (D) Fluorescence microscopy of socB-YFP or socB(Q52A)-YFP 3 hr post induction. Percentage of cells with SocB-YFP foci ± S.D. for three biological replicates is shown on right (n>500 cells per replicate). (E) Interaction between SocB-GST, SocB(Q52A)-GST, and DnaN. Performed as in Fig. 3H; as before, asterisk indicates SocB-GST N-terminal degradation products. See also Fig. S5.
Fig. 7
Fig. 7. Model for SocAB Function
Under normal growth conditions, the toxin SocB is delivered to ClpXP for degradation by its antitoxin SocA. Pol III thus remains in association with the clamp, and replication proceeds normally (left). However, in the absence of either ClpXP or SocA, SocB accumulates and competes for binding to the clamp with Pol III and other replication factors. This competition eventually results in the collapse of replication forks and induction of the RecA-mediated SOS response (right).

Comment in

References

    1. Bhat NH, Vass RH, Stoddard PR, Shin DK, Chien P. Identification of ClpP substrates in Caulobacter crescentus reveals a role for regulated proteolysis in bacterial development. Mol. Microbiol. 2013;88:1083–1092. - PMC - PubMed
    1. Bunting KA, Roe SM, Pearl LH. Structural basis for recruitment of translesion DNA polymerase Pol IV/DinB to the beta-clamp. EMBO J. 2003;22:5883–5892. - PMC - PubMed
    1. Bush K, Courvalin P, Dantas G, Davies J, Eisenstein B, Huovinen P, Jacoby GA, Kishony R, Kreiswirth BN, Kutter E, et al. Tackling antibiotic resistance. Nat. Rev. Microbiol. 2011;9:894–896. - PMC - PubMed
    1. Castro-Roa D, Garcia-Pino A, De Geiter S, van Nuland NAJ, Loris R, Zenkin N. The Fic protein Doc uses an inverted substrate to phosphorylate and inactivate EF-Tu. Nat. Chem. Biol. 2013 in press. - PMC - PubMed
    1. Chien P, Perchuk BS, Laub MT, Sauer RT, Baker TA. Direct and adaptor-mediated substrate recognition by an essential AAA+ protease. Proc. Natl. Acad. Sci. USA. 2007;104:6590–6595. - PMC - PubMed

Publication types