. 2013 Dec 5;93(6):1001-14.
doi: 10.1016/j.ajhg.2013.10.011. Epub 2013 Nov 14.

Loss-of-function mutations in TBC1D20 cause cataracts and male infertility in blind sterile mice and Warburg micro syndrome in humans

Affiliations

Loss-of-function mutations in TBC1D20 cause cataracts and male infertility in blind sterile mice and Warburg micro syndrome in humans

Ryan P Liegel et al. Am J Hum Genet. .

Abstract

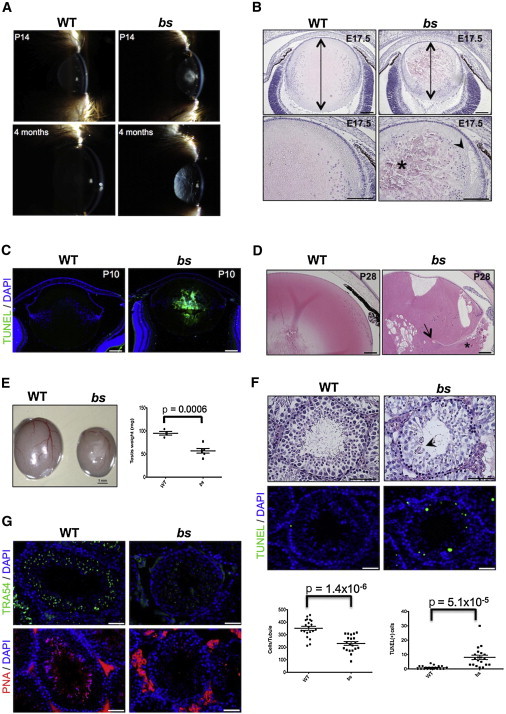
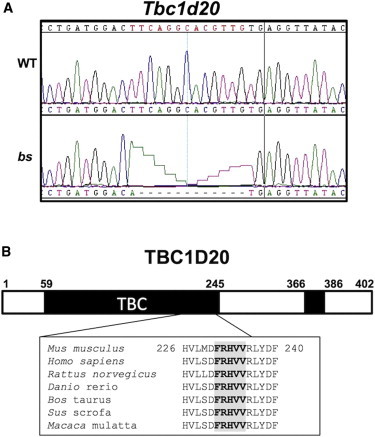
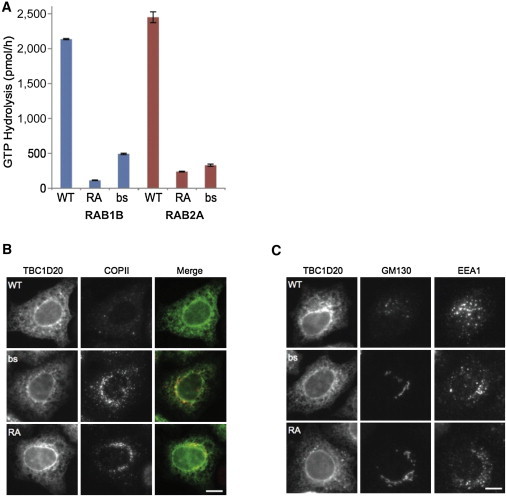
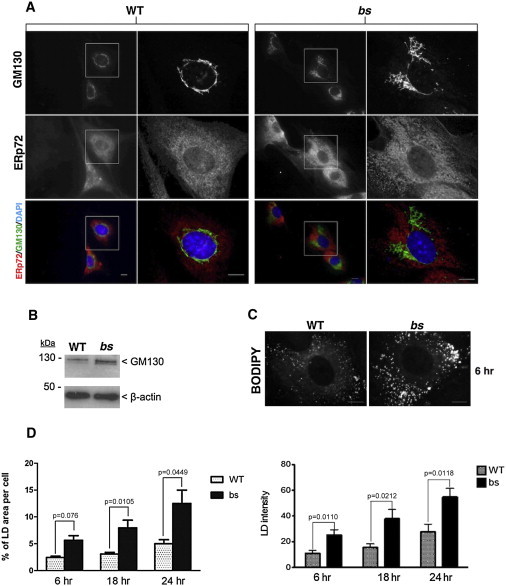
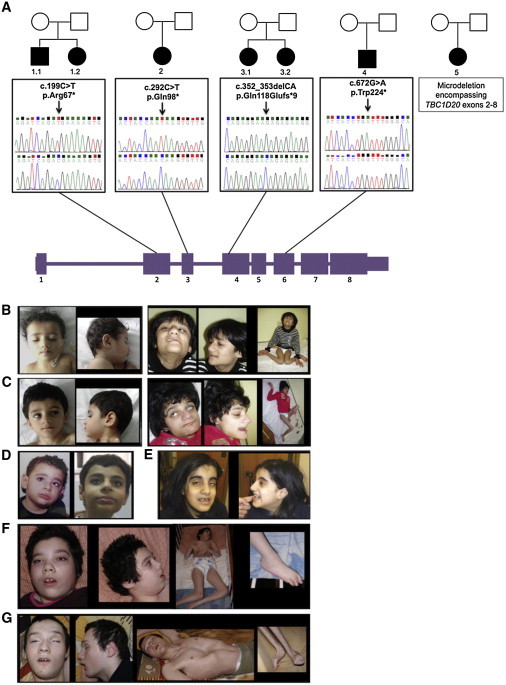
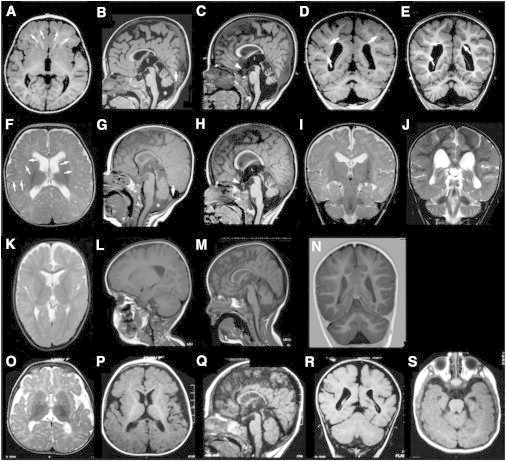
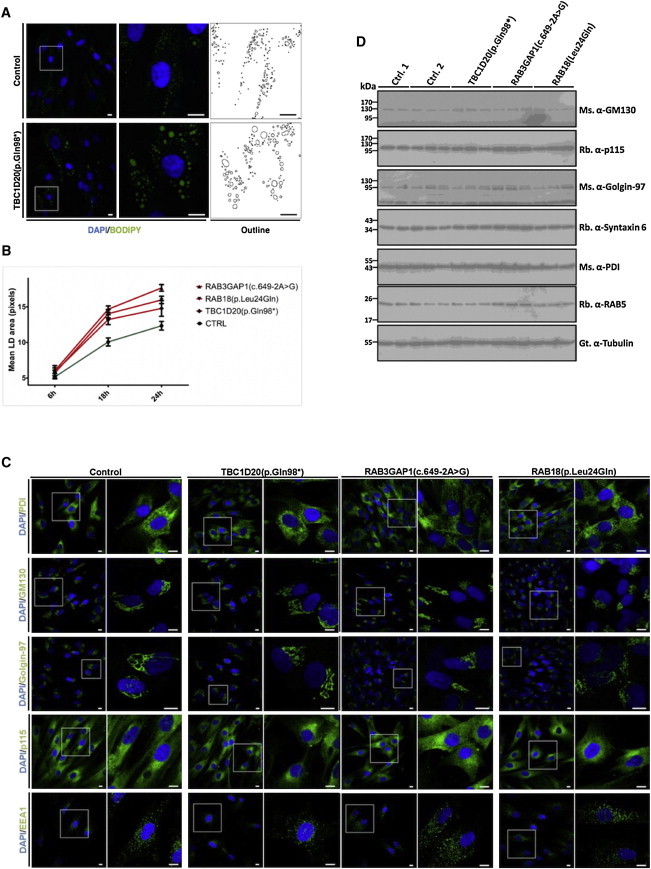
blind sterile (bs) is a spontaneous autosomal-recessive mouse mutation discovered more than 30 years ago. Phenotypically, bs mice exhibit nuclear cataracts and male infertility; genetic analyses assigned the bs locus to mouse chromosome 2. In this study, we first positionally cloned the bs locus and identified a putative causative mutation in the Tbc1d20 gene. Functional analysis established the mouse TBC1D20 protein as a GTPase-activating protein (GAP) for RAB1 and RAB2, and bs as a TBC1D20 loss-of-function mutation. Evaluation of bs mouse embryonic fibroblasts (mEFs) identified enlarged Golgi morphology and aberrant lipid droplet (LD) formation. Based on the function of TBC1D20 as a RABGAP and the bs cataract and testicular phenotypes, we hypothesized that mutations in TBC1D20 may contribute to Warburg micro syndrome (WARBM); WARBM constitutes a spectrum of disorders characterized by eye, brain, and endocrine abnormalities caused by mutations in RAB3GAP1, RAB3GAP2, and RAB18. Sequence analysis of a cohort of 77 families affected by WARBM identified five distinct TBC1D20 loss-of-function mutations, thereby establishing these mutations as causative of WARBM. Evaluation of human fibroblasts deficient in TBC1D20 function identified aberrant LDs similar to those identified in the bs mEFs. Additionally, our results show that human fibroblasts deficient in RAB18 and RAB3GAP1 function also exhibit aberrant LD formation. These findings collectively indicate that a defect in LD formation/metabolism may be a common cellular abnormality associated with WARBM, although it remains unclear whether abnormalities in LD metabolism are contributing to WARBM disease pathology.


Figures

Figure 1
Figure 1
bs Eye and Testes Phenotypes (A) Clinical image of nuclear cataracts in bs evident at P14 (top) that progress to severe vacuolated cataracts (bottom). (B) At E17.5, H&E staining showed smaller bs lens axial lengths (top, arrows); at higher magnification (bottom), disorganized lens fiber cells (asterisk) and cortical vacuoles (arrowhead) were noted. Scale bars represent 100 μm. (C) At P10 bs lenses exhibited severely degenerated TUNEL(+) nuclear fibers. Scale bars represent 100 μm. (D) At P28, H&E staining revealed severely degenerated bs lenses, large vacuoles, and ruptured lens capsule (arrow) with lenticular material present in the vitreous cavity (asterisk). Scale bars represent 100 μm. (E) Adult bs testes were significantly smaller when compared to WT (n = 6). Scale bar represents 1 mm. (F) H&E analysis (top) of adult bs seminiferous tubules (n = 20) identified significant germ cell depletion and some tubules contained multinucleate cell clusters (arrowhead) consistent with previous reports. Scale bars represent 50 μm. A significantly greater number of TUNEL(+) cells (bottom) were present in bs than in WT tubules (n = 15). Scale bars represent 25 μm. (G) TRA54 immunostaining in WT tubules revealed small punctae and crescent-shaped staining consistent with spermatocytes and round spermatids, respectively, and in bs only TRA54-positive small punctae were present, consistent with spermatocytes (top). PNA staining identified the presence of acrosomes in WT tubules, whereas no PNA-positive cells were noted in bs tubules (bottom). Scale bars represent 25 μm. DNA was stained with DAPI (blue). p values were determined by Student’s t test and error bars represent SEM.
Figure 2
Figure 2
Positional Cloning of the bs Mutation (A) c.691T>A substitution and subsequent c.692_703del deletion in exon 6 of Tbc1d20 was identified in bs (bottom); WT sequence matched the Tbc1d20 reference sequence (top). (B) The bs mutation resulting in p.Phe231Met substitution followed by an in-frame p.Arg232 _Val235 deletion affects five evolutionarily highly conserved amino acids within the TBC domain (bold gray shaded). Numbers on top of the figure refer to the amino acids from the mouse TBC1D20 protein (RefSeq NP_077158.1).
Figure 3
Figure 3
Functional Analysis of the bs Mutation (A) In the presence of RAB1B or RAB2A, mouse TBC1D20 protein has a high rate of GTP hydrolysis; bs mutant protein results in much lower GTP hydrolysis rate when compared to WT and slightly higher rate than a catalytically inactive RA mutant. Each point on the graph represents the mean values from three independent experiments and error bars indicate SD. (B and C) Overexpression of mouse WT TBC1D20 caused disruption of COPII ER-Golgi transport vesicles as evident after immunostaining with SEC31 marker (B) and disruption of cis-Golgi as evident after immunostaining with GM130 without disruption of endosomes as evident after immunostaining with EEA1 (C). The TBC1D20-bs mutant protein, like the catalytically inactive RA mutant protein, had little effect on COPII, Golgi, or endosomal markers. Scale bars represent 10 μm.
Figure 4
Figure 4
bs mEFs Cellular Phenotypes (A) GM130 immunostaining (green) revealed enlarged cis-Golgi in bs mEFs, when compared to WT mEFs. ER immunostaining with ERp72 (red) did not identify any differences between WT and bs mEFs. DNA was stained with DAPI (blue). (B) Immunoblot analysis revealed greater levels of GM130 protein present in bs than in WT mEF cell lysates relative to β-actin. (C) Oleic acid treatment for 6 hr after staining with the neutral lipid dye BODIPY 493/503 revealed expanded LD structures in bs when compared to WT mEFs. (D) Quantification analyses after oleic acid treatment for 6, 18, and 24 hr confirmed significantly greater size and fluorescence intensity of LDs in bs mEFs when compared to WT mEFs. Shown in the graphs are mean values per cell (>30 cells). p values shown on top of each graph were determined by Student’s t test and error bars represent SEM. Scale bars represent 5 μm.
Figure 5
Figure 5
Pedigrees, TBC1D20 Mutations, and Clinical Features of Individuals with WARBM (A) Filled symbols indicate individuals with WARBM and numbers represent individual identifiers. Chromatograms of germline TBC1D20 mutations in exons 2, 3, 4, and 6 are shown below each pedigree (top) and controls (bottom). The TBC1D20 mutation in individual 5 is a microdeletion encompassing exons 2 thorough 8 confirmed by qPCR. (B–G) Predominant clinical features of individuals with WARBM with TBC1D20 mutations included microcephaly, low anterior hairline, broad dense laterally descending eyebrows, microphthalmia, low anterior hairline, prominent subnasal region and chin, kyphoscoliosis, severe spastic quadriplegia with contractures, and diminished muscle bulk. Permission was obtained from parents of individuals with WARBM for publication of these images. (B) Individual 3.1 shown at age 3 (first two panels) and age 13 (last three panels). (C) Individual 3.2 (sister of individual 3.1 shown in B) at age 1 (first two panels) and at age 11 (last three panels). (D) Individual 4 is shown at age 3 (first panel) and age 14 (second panel). (E) Individual 5 is 15 years old. (F) Individual 1.1 is 21 years old. (G) Individual 1.2 (brother of individual 1.1 shown in F) is 16 years old.
Figure 6
Figure 6
Brain MRIs from Individuals with TBC1D20 Mutations (A–E) Individual 3.1 at age 2 years (A–C) and at age 4 years and 11 months (D, E). (F–J) Individual 3.2 at age 6 months (F–I) and at 2 years and 8 months (H, J). (K–N) Individual 2 at age 2 years and 6 months. (O–S) Individual 4 at age 7 months. The general pattern is similar in all individuals: predominantly frontal polymicrogyria (arrows in A), which sometimes extends to the Sylvian fissures and temporal and occipital lobes (E–G), corpus callosum hypogenesis, particularly of the splenium (B, G, M, Q), and enlarged cisterna magna (asterisks in B and G and also shown in C, H, M, and Q) due to cerebellar vermis hypoplasia. Follow-up of the two sisters 3.1 (C and E) and 3.2 (H and J) showed clear atrophy of the cerebellar vermis and hemispheres in both individuals. The optic chiasm was also hypoplastic in both these individuals (arrowheads in C and H).
Figure 7
Figure 7
WARBM Fibroblasts Cellular Phenotypes (A) Treatment of TBC1D20 (p.Gln98) fibroblasts with 400 μM oleic acid for 18 hr resulted in a significantly greater size of LDs when compared to identically treated controls. LDs were stained with the neutral lipid dye BODIPY 493/503 (green) and DNA was stained with DAPI (blue). (B) Oleic acid treatment of RAB18 (p.Leu24Gln) and RAB3GAP1 (c.649−2A>G) fibroblasts for 18 or 24 hr also resulted in significantly larger LDs when compared to controls (>30 cells); the error bars indicate SEM. (C) Immunofluorescence analysis with PDI as an ER marker; GM130, Golgin-97, and p115 as Golgi markers; and EEA1 as an endosomal marker did not identify any difference between TBC1D20 (p.Gln98), RAB18 (p.Leu24Gln), RAB3GAP1 (c.649−2A>G), and control fibroblasts. Scale bars represent 10 μm. (D) Immunoblot analysis of cell lysates from TBC1D20 (p.Gln98), RAB18 (p.Leu24Gln), RAB3GAP1 (c.649−2A>G), and control fibroblasts did not identify any differences in expression of GM130, Golgin-97, p115, Syntaxin 6, PDI, and RAB5 proteins.

References

    1. Warburg M., Sjö O., Fledelius H.C., Pedersen S.A. Autosomal recessive microcephaly, microcornea, congenital cataract, mental retardation, optic atrophy, and hypogenitalism. Micro syndrome. Am. J. Dis. Child. 1993;147:1309–1312. - PubMed
    1. Aligianis I.A., Johnson C.A., Gissen P., Chen D., Hampshire D., Hoffmann K., Maina E.N., Morgan N.V., Tee L., Morton J. Mutations of the catalytic subunit of RAB3GAP cause Warburg Micro syndrome. Nat. Genet. 2005;37:221–223. - PubMed
    1. Abdel-Salam G.M., Hassan N.A., Kayed H.F., Aligianis I.A. Phenotypic variability in Micro syndrome: report of new cases. Genet. Couns. 2007;18:423–435. - PubMed
    1. Morris-Rosendahl D.J., Segel R., Born A.P., Conrad C., Loeys B., Brooks S.S., Müller L., Zeschnigk C., Botti C., Rabinowitz R. New RAB3GAP1 mutations in patients with Warburg Micro Syndrome from different ethnic backgrounds and a possible founder effect in the Danish. Eur. J. Hum. Genet. 2010;18:1100–1106. - PMC - PubMed
    1. Handley M.T., Morris-Rosendahl D.J., Brown S., Macdonald F., Hardy C., Bem D., Carpanini S.M., Borck G., Martorell L., Izzi C. Mutation spectrum in RAB3GAP1, RAB3GAP2, and RAB18 and genotype-phenotype correlations in warburg micro syndrome and Martsolf syndrome. Hum. Mutat. 2013;34:686–696. - PubMed

Publication types

MeSH terms

Substances

Supplementary concepts