

Validation of the isotropic fractionator: comparison with unbiased stereology and DNA extraction for quantification of glial cells
- PMID: 24239779
- PMCID: PMC3904371
- DOI: 10.1016/j.jneumeth.2013.11.002
Validation of the isotropic fractionator: comparison with unbiased stereology and DNA extraction for quantification of glial cells
Abstract
Background: The "isotropic fractionator" (IF) is a novel cell counting technique that homogenizes fixed tissue, recovers cell nuclei in solution, and samples and quantifies nuclei by extrapolation. Studies using this technique indicate that the ratio of glia to neurons in the human brain is approximately 1:1 rather than the 10:1 or 50:1 ratio previously assumed. Although some results obtained with the IF have been similar to those obtained by stereology, the IF has never been calibrated or validated. It is conceivable that only a fraction of glial cell nuclei are recovered intact or recognized after the homogenization step.
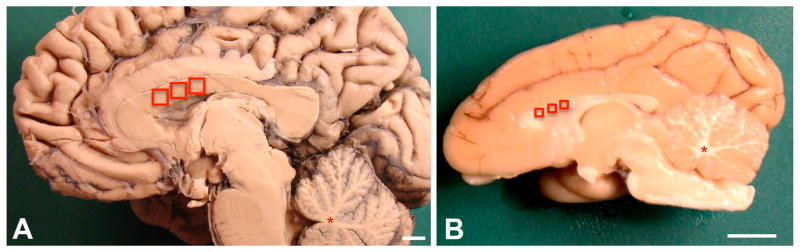
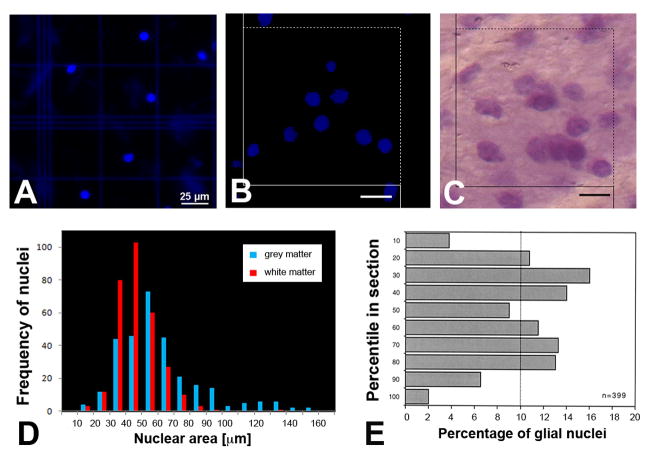
New method: To rule out this simple explanation for the claim of a 1:1 glia-neuron ratio, we compared cell numbers obtained from adjacent, weight-normalized samples of human and macaque monkey white matter using three techniques: the IF, unbiased stereology of histological sections in exhaustively sectioned samples, and cell numbers calculated from DNA extraction.
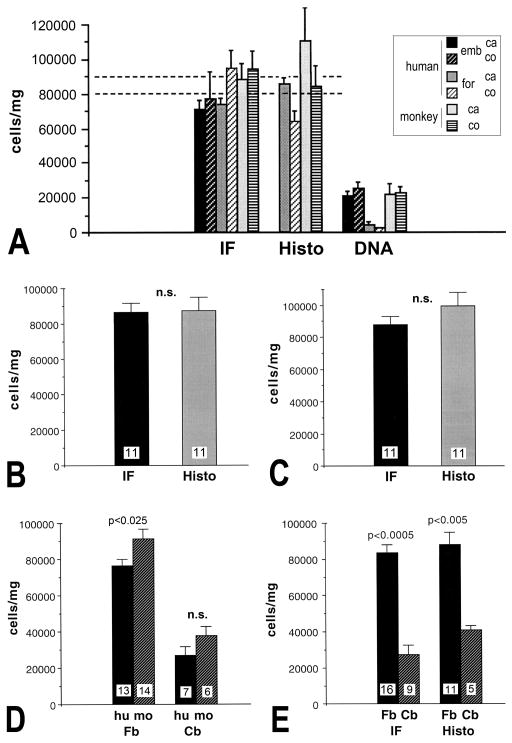
Results and comparison of methods: In primate forebrains, the IF yielded 73,000-90,000 nuclei/mg white matter, unbiased stereology yielded 75,000-92,000 nuclei/mg, with coefficients of error ranging from 0.013 to 0.063, while DNA extraction yielded only 4000-23,000 nuclei/mg in fixed white matter tissues.
Conclusions: Since the IF revealed about 100% of the numbers produced by unbiased stereology, there is no significant underestimate of glial cells. This confirms the notion that the human brain overall contains glial cells and neurons with a ratio of about 1:1 - far from the originally assumed ratio of 10:1 in favor of glial cells.
Keywords: Bias; Brain; Calibration; Glia-neuron ratio; Glial cell; Human; Isotropic fractionator; Primate; Quantification; Stereology; White matter.
Copyright © 2013 Elsevier B.V. All rights reserved.
Figures
References
-
- Andersen BB, Korbo L, Pakkenberg B. A quantitative study of the human cerebellum with unbiased stereological techniques. J Comp Neurol. 1992;326:549–60. - PubMed
-
- Andersen BB, Gundersen HJ. Pronounced loss of cell nuclei and anisotropic deformation of thick sections. J Microsc. 1999;196:69–73. - PubMed
-
- Andrade-Moraes CH, Oliveira-Pinto AV, Castro-Fonseca E, da Silva CG, Guimarães DM, Szczupak D, Parente-Bruno DR, Carvalho LR, Polichiso L, Gomes BV, Oliveira LM, Rodriguez RD, Leite RE, Ferretti-Rebustini RE, Jacob-Filho W, Pasqualucci CA, Grinberg LT, Lent R. Cell number changes in Alzheimer’s disease relate to dementia, not to plaques and tangles. Brain. 2013 Oct 17; Epub ahead of print. - PMC - PubMed
-
- Azevedo FA, Carvalho LR, Grinberg LT, Farfel JM, Ferretti RE, Leite RE, Jacob Filho W, Lent R, Herculano-Houzel S. Equal numbers of neuronal and nonneuronal cells make the human brain an isometrically scaled-up primate brain. J Comp Neurol. 2009;513:532–41. - PubMed
-
- Bahney J, Altick AL, von Bartheld CS. Equal numbers of glia and neurons in the human brain. A validation study of the new isotropic fractionator technique. Soc Neurosci Abstr. 2012:#710.15.
Publication types
MeSH terms
Grants and funding
LinkOut - more resources
Full Text Sources
Other Literature Sources
Research Materials
Miscellaneous
