Comparative Study
. 2014 Jan 15;385(2):263-78.
doi: 10.1016/j.ydbio.2013.11.002. Epub 2013 Nov 14.

A comparative study of Pointed and Yan expression reveals new complexity to the transcriptional networks downstream of receptor tyrosine kinase signaling

Affiliations
Comparative Study

A comparative study of Pointed and Yan expression reveals new complexity to the transcriptional networks downstream of receptor tyrosine kinase signaling

Jean-François Boisclair Lachance et al. Dev Biol. .

Abstract

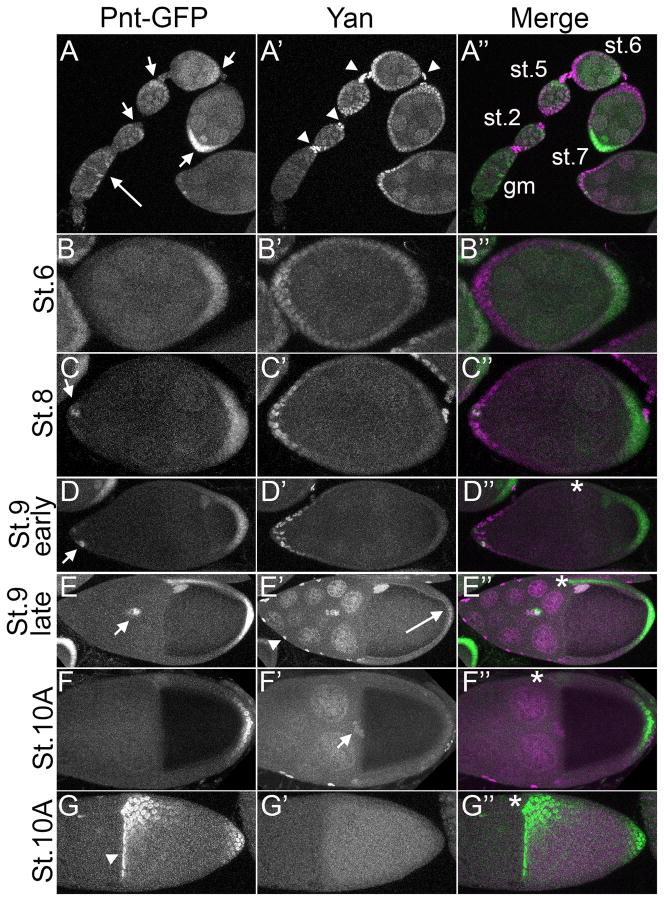
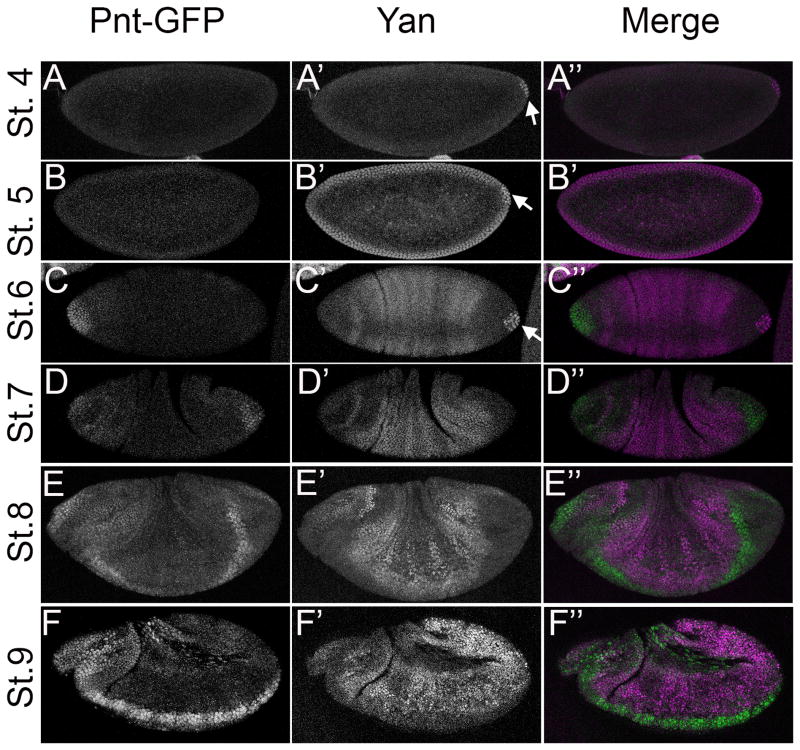
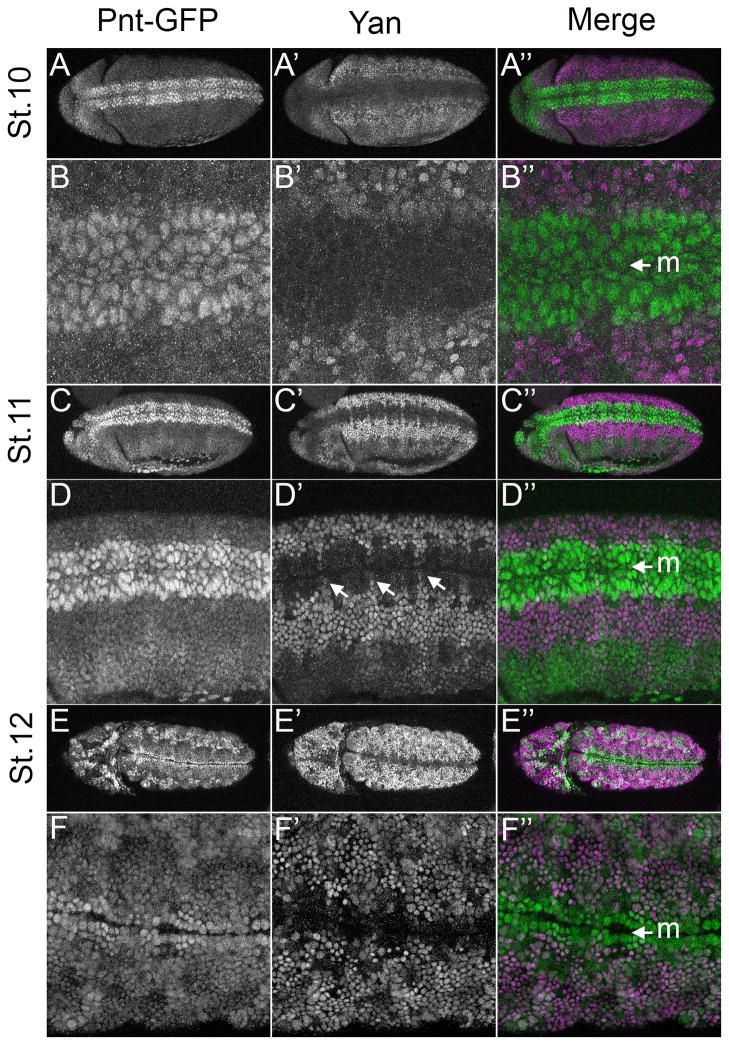
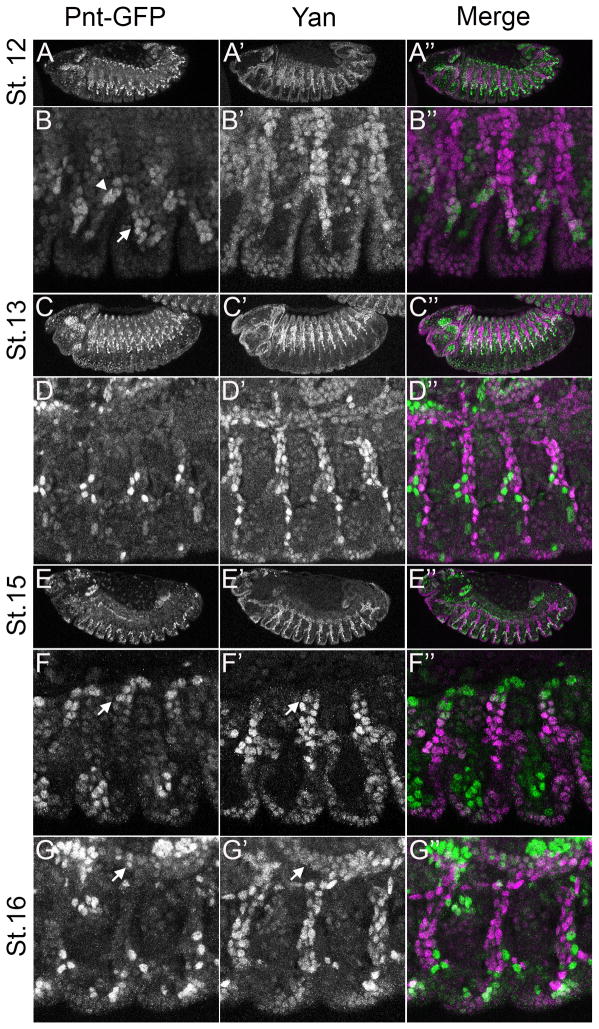
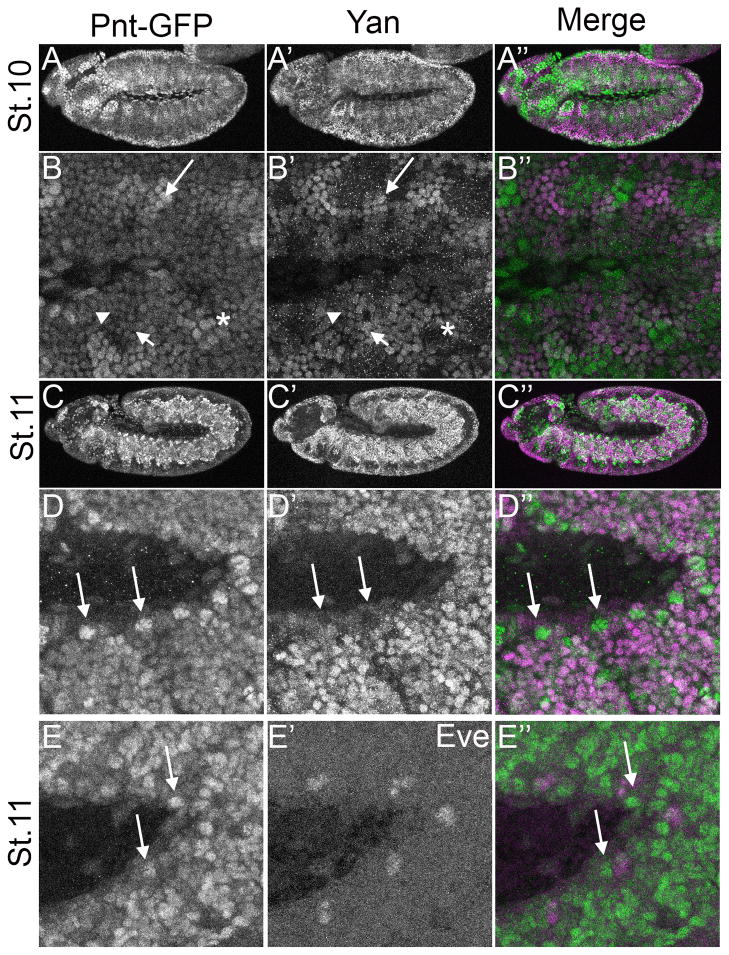
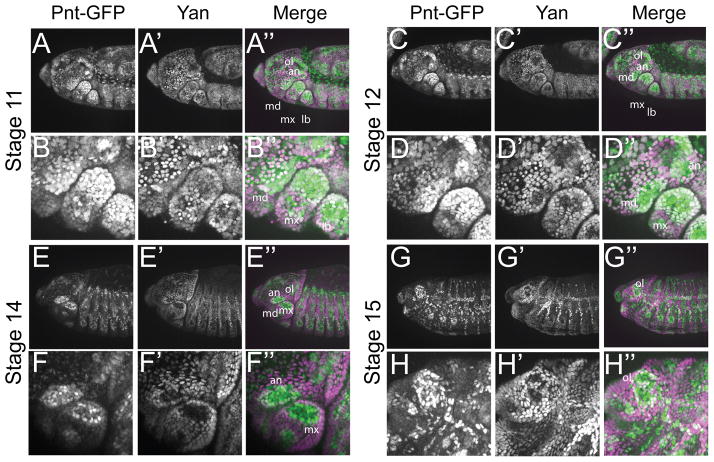
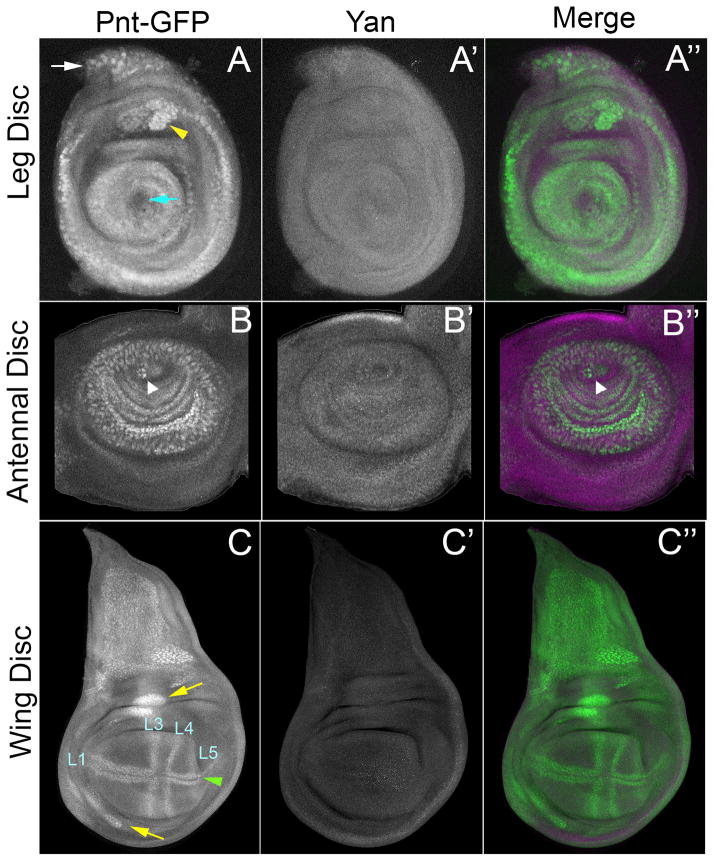
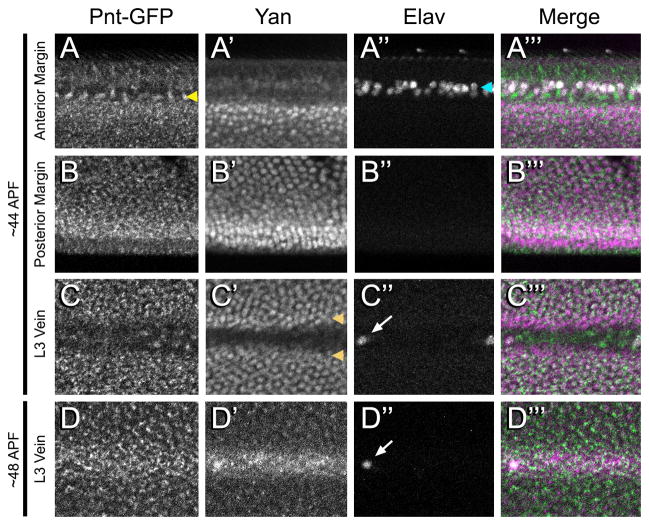
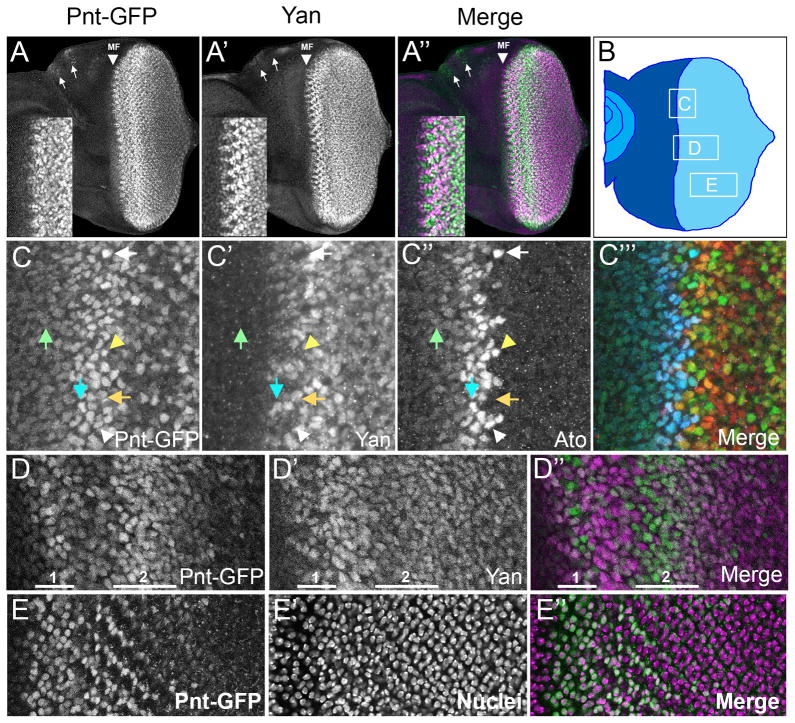
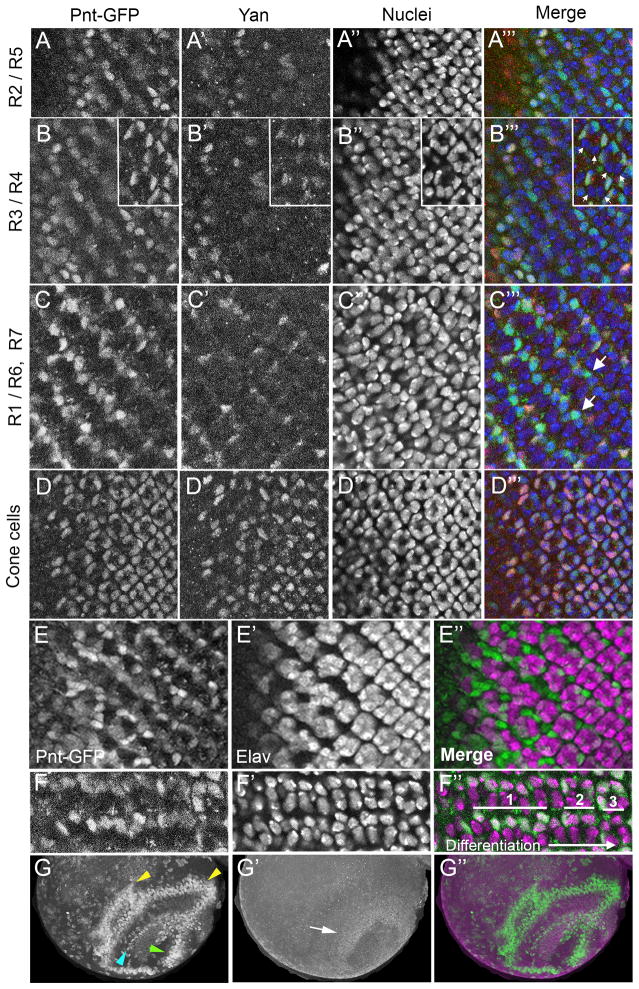
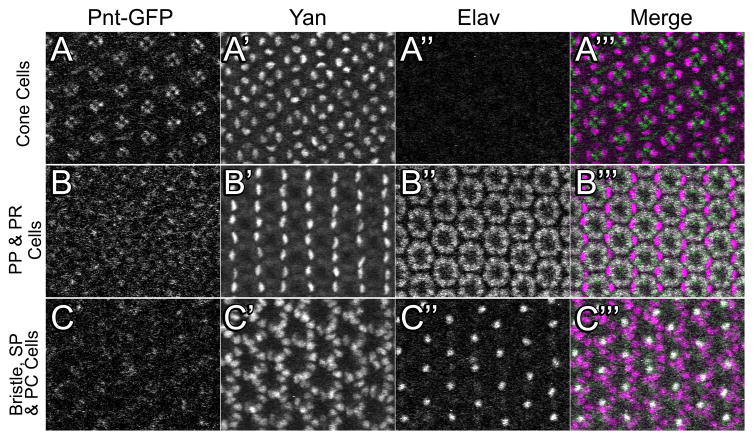
The biochemical regulatory network downstream of receptor tyrosine kinase (RTK) signaling is controlled by two opposing ETS family members: the transcriptional activator Pointed (Pnt) and the transcriptional repressor Yan. A bistable switch model has been invoked to explain how pathway activation can drive differentiation by shifting the system from a high-Yan/low-Pnt activity state to a low-Yan/high-Pnt activity state. Although the model explains yan and pnt loss-of-function phenotypes in several different cell types, how Yan and Pointed protein expression dynamics contribute to these and other developmental transitions remains poorly understood. Toward this goal we have used a functional GFP-tagged Pnt transgene (Pnt-GFP) to perform a comparative study of Yan and Pnt protein expression throughout Drosophila development. Consistent with the prevailing model of the Pnt-Yan network, we found numerous instances where Pnt-GFP and Yan adopt a mutually exclusive pattern of expression. However we also observed many examples of co-expression. While some co-expression occurred in cells where RTK signaling is presumed low, other co-expression occurred in cells with high RTK signaling. The instances of co-expressed Yan and Pnt-GFP in tissues with high RTK signaling cannot be explained by the current model, and thus they provide important contexts for future investigation of how context-specific differences in RTK signaling, network topology, or responsiveness to other signaling inputs, affect the transcriptional response.

Keywords: Drosophila; EGFR signaling; ETS transcription factor; Embryo; Gene regulation; Imaginal discs.


Figures

Figure 1
Figure 1. Pnt-GFP expression overlaps with Yan expression in early egg chambers and during border cell migration
All images are lateral projections of the relevant optical slices except G–G″ which represent a dorsal projection of an egg chamber. Anterior is left and where relevant, dorsal is up and marked by an asterisk. For the merge, Pnt-GFP is in green and Yan in magenta. A–A″: Ovariole showing germarium (gm) to stage 7 egg chambers. Pnt-GFP expression is detected in the gm (long arrow), while Yan expression is below detectable levels. Starting in stage 2 egg chambers, Pnt-GFP is most prominent in posterior follicle cells (FCs), (short arrows). Yan is more uniformly expressed in all FCs, with highest expression of Yan detected in stalk cells (arrowheads). Note that Pnt-GFP appears to be both nuclear and cytoplasmic. B–B″: By stage 6, Pnt-GFP expression is restricted to posterior FCs while Yan expression is maintained at high levels in anterior FCs and to a lower extent posterior FCs in contact with the oocyte. C–C″: Yan expression is present in anterior FCs in stage 8 egg chambers. Pnt-GFP is mostly restricted to posterior FCs, but a few GFP-positive FCs are detected at the anterior tip (arrow). D–D″: In early stage 9 egg chambers, anterior expression of Pnt-GFP has increased (arrow). Pnt-GFP in dorso-posterior FCs appears as a gradient. Weak Pnt-GFP expression is visible in the oocyte nucleus. E–E″: Migrating border cells (BCs) express both Pnt-GFP and Yan (arrow) at late stage 9, as does the oocyte nucleus. Yan is highly expressed in stretch cells covering the nurse cells (arrowheads) and in nurse cell nuclei. Weak expression is detected in posterior FCs (long arrow). High Pnt-GFP expression is visible at the dorsal anterior and posterior region of the follicular epithelium, while intermediate levels of expression are visible in-between these regions. F–F″: By stage 10A, once BCs have finished their migration towards the oocyte, Yan expression is maintained but Pnt-GFP is lost (arrow). High expression of Pnt-GFP is maintained in posterior FCs. Yan expression appears to have dropped off everywhere except the stretch cells (arrowhead) G–G″: Dorsal view of stage 10A egg chamber showing strong Pnt-GFP expression in the dorsal midline region and in the anteriormost follicle cells of the dorsal region (arrowhead). Yan expression has fallen below detection threshold.
Figure 2
Figure 2. Pnt-GFP and Yan have mostly non-overlapping expression patterns in the early embryo
All images are projections of the relevant optical slices (except G–G″) of embryos carrying two copies of Pnt-GFP. Lateral view of early to mid-stage embryos (except C–C″ which show a dorsal view) are oriented anterior to the left and dorsal up. For the merge, Pnt-GFP is in green and Yan in magenta. A–A″: Yan expression is detected first in pole cells at posterior of stage 4 embryos (arrow). B–B″: Yan is expressed after cellularization in all cells of the blastoderm and in pole cells (arrow). C–C″: Pnt-GFP expression is first detected in an anterior cap of cells at stage 6. Yan expression remains strong in pole cells (arrow) but is lost in the somatic cells at both termini. Moderate expression is detected in a pattern of lateral stripes, with reduced expression near the dorsal midline. D–D″: By stage 7, Pnt-GFP expression is detected at both termini, while Yan expression increases in lateral regions. E–E″: Expression is essentially complementary at stage 8, with Pnt-GFP in ventral cells. Low levels of lateral Pnt-GFP expression overlap with Yan. F–F″: At stage 9, Pnt-GFP expression is strong in the region of the developing brain and ventral nerve cord and weaker everywhere else except for the amnioserosa (arrow). Yan expression appears in a complementary pattern.
Figure 3
Figure 3. Complementary Pnt-GFP and Yan expression in the ventral neuroectoderm
All images are ventral projections of embryos carrying two copies of Pnt-GFP and oriented anterior is to the left. The ventral midline (M) is indicated by an arrow. For the merge, Pnt-GFP is in green and Yan in magenta. A–A″: Pnt-GFP expression is enriched ventrally where Yan is excluded. B–B″: Close-up view of the embryo in A–A″ showing the ventral domain of high Pnt-GFP flanked by a lateral domain of high Yan. Pnt-GFP is strongly expressed in 3–4 rows of cells on each side of the midline (M) and weakly expressed beyond. Yan is not detectable in any of these rows but is expressed at higher levels than Pnt in ventral-lateral cells. C–C″: By stage 11, Pnt-GFP has increased throughout the embryo, but the highest levels remain in the ventral neuroectoderm where Yan expression is absent. D–D″: Close-up view of the stage 11 embryo in C–C′ highlights three domains of differential Pnt-GFP/Yan expression: 2–3 rows of ventral-most cells each side of the midline have high Pnt-GFP and mostly lack Yan; ventro-lateral cells express high Yan and low Pnt-GFP; and more lateral cells have moderate levels of Pnt-GFP and low Yan. A segmentally repeating pattern of small clusters of cells expressing both high Yan and Pnt-GFP is seen in the lateral and intermediate rows (arrows). E–E″: At stage 12, only the lateral row of the ventral Pnt-GFP expression remains. Yan expression is absent from these lateral rows, and strong in immediately flanking cells, which also have moderate Pnt-GFP expression. F–F″: Higher magnification view of the embryo in E–E″.
Figure 4
Figure 4. Complementarity of Pnt-GFP and Yan expression during tracheal development
All images are lateral projections of embryos carrying two copies of Pnt-GFP and oriented anterior is to the left and dorsal is up. For the merge, Pnt-GFP is in green and Yan in magenta. A–B″: Pnt-GFP and Yan expression overlap in lateral anterior trunk branches (arrowhead) and in lateral posterior branches (arrow). C–C″: Most tracheal cells at this stage express high Yan levels whereas strong Pnt-GFP is only seen in 3–4 cells per segment. D–D″: Close-up view of tracheal branches imaged in C–C″. The Pnt-GFP expressing cells flank a region of high Yan expressing cells (arrow). E–E″: At stage 15, most tracheal cells continue to express high Yan and low Pnt-GFP. F–F″: Some overlap is visible in the dorsal branch in the zoomed in view of the stage 15 embryo (arrow). G–G″: High magnification of a stage 16 embryo shows that both Pnt-GFP and Yan are expressed in the dorsal trunk (arrow).
Figure 5
Figure 5. Coexpression of Pnt-GFP and Yan in the developing mesoderm
All images are lateral projections of embryos carrying two copies of Pnt-GFP. For the merge, Pnt-GFP is in green and Yan in magenta. A–A″: With the exception of the amnioserosa and some head structures, stage 10 embryos exhibit extensively overlapping Pnt-GFP and Yan expression. B–B″: Higher magnification of the embryo depicted in A–A″ shows that although most cells express both Yan and Pnt-GFP, their levels are not uniform: some cells express low levels of both proteins (arrowhead); some express high levels of one and low levels of the other (short arrow); some show high levels of both (long arrow); and a few cells have high Pnt-GFP but no Yan (asterisk). C–C″: Both Pnt-GFP and Yan expression appear upregulated in the mesoderm at stage 11. D–D″: High magnification view of the embryo in C–C″ highlights the extensive overlap, but also identifies a segmentally arrayed cluster of cells that only express high Pnt-GFP (long arrows). E–F″: These cell clusters do not overlap with Eve expression in the heart muscle precursors at stage 11 and onwards (not shown).
Figure 6
Figure 6. Yan and Pnt-GFP expression during head formation
All images are lateral projections of embryos carrying two copies of Pnt-GFP and oriented anterior is to the left and dorsal is up. For the merge, Pnt-GFP is in green and Yan in magenta. A–A″: At stage 11, Pnt-GFP and Yan levels increase in the head region. Low level of overlap is seen throughout the head. Strong overlap is visible in the optic lobe (ol) and the antennal lobe (an) as well as the in the mandillar (md), maxillary (mx) and labial gnathal segments. B–B″: Close-up view of the head shown in B–B″. C–C″: At stage 12, the overlap between Pnt-GFP and Yan remains strong in the ol and the an, but begins to decrease in the md, mx and lb segments. D–D″: Close-up view of head structures shown in D–D″. E–E″: The overlap between Pnt-GFP and Yan remains strong only in the ol. In the an, Pnt-GFP and Yan begin to adopt a complementary pattern. A mutually exclusive pattern of expression between Pnt-GFP and Yan is visible in gnathal segments. F–F″: Close-up view of an and mx regions shown in F–F″. G–G″: By stage 15, Pnt-GFP and Yan adopt a complementary pattern in most of the head. At the center of the ol region, Yan expression is gone while Pnt-GFP expression remains strong. Strong Pnt-GFP and Yan co-expression is observable around this central region. H–H″: Closeup view of the head structures shown in G–G″.
Figure 7
Figure 7. Pnt-GFP and Yan expression in third instar imaginal discs
All images are confocal projections. (A–A″) Leg disc. (B–B″) Antennal disc. (C–C″) Wing disc. Pnt-GFP (A, B, C), Yan (A′, B′, C′), and a merge of the two (A″, B″, C″) are shown. The merge shows Pnt-GFP (green) and Yan (purple) in the same image. For the wing disc, presumptive Pnt-GFP-positive wing veins are indicated. All images are oriented anterior-left and dorsal-up.
Figure 8
Figure 8. Pnt-GFP and Yan expression in the pupa wing
A–Ctprime;: A wing from a pupa ~44h APF showing a region from the anterior wing margin (A–A‴), posterior wing margin (B–B‴), and L3 wing vein (C–C‴). Note the adjacent rows of Pnt-GFP cells (yellow arrowhead) and Elav cells (cyan arrowhead) along the anterior margin. Also note the two rows of cells bordering the L3 vein (orange arrowheads) that exclusively contain Yan. D–D‴: A wing from a pupa ~48h APF showing the L3 wing vein. Pnt-GFP (A–D), Yan (A′–D′), Elav (A″–D″) and a merge (A‴–D‴) are shown. The merge shows Pnt-GFP (green), Yan (purple) and Elav (white) in the same image. The region of the L3 vein shown in C and D is mid-wing, where the left-most Elav-positive cell is the L3.1 sensory cell (arrows). All images are oriented anterior-up and distal-left.
Figure 9
Figure 9. Pnt-GFP and Yan expression in the larval eye imaginal disc
(A–A″) Confocal projection of Pnt-GFP (green) and Yan (purple) in the developing eye disc. Position of the morphogenetic furrow (MF) is indicated, as are the ocelli (arrows). Insets show a magnified view of Yan and Pnt-GFP near the MF. (B) Diagram of an eye imaginal disc with the MF bisecting the undifferentiated anterior region (dark blue) and differentiating posterior region (light blue). Boxes outline the approximate locations of regions magnified in the subsequent panels of this figure. Letters inside boxes correspond to specific panels. (C–C‴) Expression of Pnt-GFP (C), Yan (C′), and Ato (C″) in a zone that spans the MF and includes cells at different stages of Ato expression, arrayed from anterior to posterior. The first stage has a broad band of anterior cells co-expressing low levels of Pnt-GFP and Ato (green arrow). At the onset of the second stage, Ato and Pnt-GFP expression increases, and some cells also begin to express Yan (cyan arrow). This stage has intermediate groups (IGs) expressing high levels of Ato and Pnt-GFP but not expressing Yan (white arrowhead). The cells between each IG express no Ato, but do express high levels of Pnt-GFP and increased levels of Yan (orange arrow). Two or three posterior cells in each IG express the highest level of Ato, and these cells are the R8 equivalence group (yellow arrowhead). The third stage has a single Ato-positive cell, which is fated to become the R8 cell (white arrow). Pnt-GFP levels remain high or even increase in this cell, while Yan is not detected above background. The merge (C‴) shows Pnt-GFP (green), Yan (red) and Ato (blue) in the same image. (D–D″) Expression of Pnt-GFP (green) and Yan (purple) in uncommitted precursor cells posterior to the MF. Highlighted 1 and 2 are two successive regions of induction of Pnt-GFP (these do not correspond to the stages of Ato expression described in C). Note that Yan is broadly expressed in precursors and is upregulated in the zone spanning the two regions of Pnt-GFP induction. More posterior, the precursor cells lose Pnt-GFP. (E–E″) Expression of Pnt-GFP (green) in cells within the second wave of induction (left) and in differentiating photoreceptors (right). The protein is primarily nuclear (purple). All images are oriented anterior-left and dorsal-up.
Figure 10
Figure 10. Pnt-GFP and Yan expression in the visual system
All images are oriented anterior-left and dorsal-up. (A–A‴) Ommatidia located immediately posterior to the morphogenetic furrow, soon after R2/R5 commitment. Shown is a section containing R2 and R5 cell nuclei. (B–B‴) Sections through ommatidia highlighting R3 and R4 cell nuclei. Ommatidia in the main panel are at the stage soon after R3/R4 commitment. The inset shows ommatidia at the two-cone-cell stage, many hours after R3/R4 commitment. Arrows mark R3 and R4 nuclei, which display a lack of Yan and Pnt-GFP. (C–C‴) A section through ommatidia highlighting R1, R6, and R7 cell nuclei. Anterior ommatidia (left) are at a stage shortly after R1/R6 commitment. These ommatidia show Pnt-GFP expression in R1 and R6 nuclei that decreases as the ommatidia mature – those ommatidia more posterior (right). Arrows highlight R7 nuclei that are Pnt-GFP positive. This expression is also transient. (D–D‴) Ommatidia that are at various stages of cone cell commitment. The section shows cone cell nuclei, which co-express Pnt-GFP and Yan. Pnt-GFP (A–D), Yan (A′–D′), DAPI-stained nuclei (A″–D″), and the merge (A‴–D‴) are shown. The merge is colored for Pnt-GFP (green), Yan (red), and nuclei (blue). (E–E″) A section through a disc where the left side shows ommatidia with cells undergoing photoreceptor fate commitment and the right side shows ommatidia at stages after fate commitment (right). The section displays differentiating photoreceptor nuclei, which express the Elav protein (purple). These nuclei generally lack Pnt-GFP (green). Pnt-GFP instead is prominent in the nuclei of cells undergoing fate commitment and not yet expressing Elav. (F–F″) Highly magnified view of Pnt-GFP (green) in two rows of ommatidia from a section showing photoreceptor nuclei (purple). Their differentiation progresses from left to right. Photoreceptors highlighted with 1 have Pnt-GFP primarily in the nucleus, while photoreceptors highlighted with 2 have primarily cytoplasmic Pnt-GFP. Photoreceptors highlighted with 3 show reduction of cytoplasmic Pnt-GFP. (G–G″) Dorsal view of one optic lobe in the third instar brain showing Pnt-GFP (green) and Yan (purple). Stripes of Pnt-GFP (yellow and cyan arrowheads) in the medulla and a cluster of Pnt-GFP (green arrowhead) in the lamina. These are complementary to a ring of Yan-positive cells (white arrowhead).
Figure 11
Figure 11. Pnt-GFP and Yan expression in the 48hr APF pupal eye
Three optical sections from the same eye are shown with 25 ommatidia in the field of view. For each section, Pnt-GFP (A, B, C), Yan (A′, B′, C′), Elav (A″, B″, C″), and a merge (A‴, B‴, C‴) are shown. The merge shows Pnt-GFP (green), Yan (purple) and Elav (white) in the same image. (A–A‴) An apical section showing the cytoplasmic projections of photoreceptor (PR) cells and the nuclei of the cone cells. (B–B‴) A medial section showing primary pigment (PP) cell nuclei and Elav-positive PR cell nuclei. (C–C‴) A basal section showing interommatidial bristle cell nuclei (bristle neurons are positive for Elav), secondary pigment (SP) cell nuclei, and tertiary pigment (TP) cell nuclei. All images are oriented anterior-left and dorsal-up.

References

    1. Affolter M, Itoh N, Shilo B, Thiery J, Werb Z. Tube or Not Tube : Remodeling Epithelial Tissues by Branching Morphogenesis Branching morphogenesis involves the restructuring. Development. 2003;4:11–18. - PubMed
    1. Amin Ghabrial SL, Metzstein Mark M, Krasnow MA. BRANCHING MORPHOGENESIS OF THE DROSOPHILA TRACHEAL SYSTEM 2003 - PubMed
    1. Blair SS. Wing vein patterning in Drosophila and the analysis of intercellular signaling. Annual review of cell and developmental biology. 2007;23:293–319. - PubMed
    1. Boisclair Lachance JF, Fregoso Lomas M, Eleiche A, Bouchard Kerr P, Nilson LA. Graded Egfr activity patterns the Drosophila eggshell independently of autocrine feedback. Development Cambridge England. 2009;136:2893–2902. - PubMed
    1. Brunner D, Dücker K, Oellers N, Hafen E, Scholz H, Klämbt C. The ETS domain protein pointed-P2 is a target of MAP kinase in the sevenless signal transduction pathway. Nature. 1994;370:386–9. - PubMed

Publication types

MeSH terms

LinkOut - more resources