. 2013 Dec 11;32(24):3145-60.
doi: 10.1038/emboj.2013.245. Epub 2013 Nov 15.

Transcriptome sequencing during mouse brain development identifies long non-coding RNAs functionally involved in neurogenic commitment

Affiliations

Transcriptome sequencing during mouse brain development identifies long non-coding RNAs functionally involved in neurogenic commitment

Julieta Aprea et al. EMBO J. .

Abstract

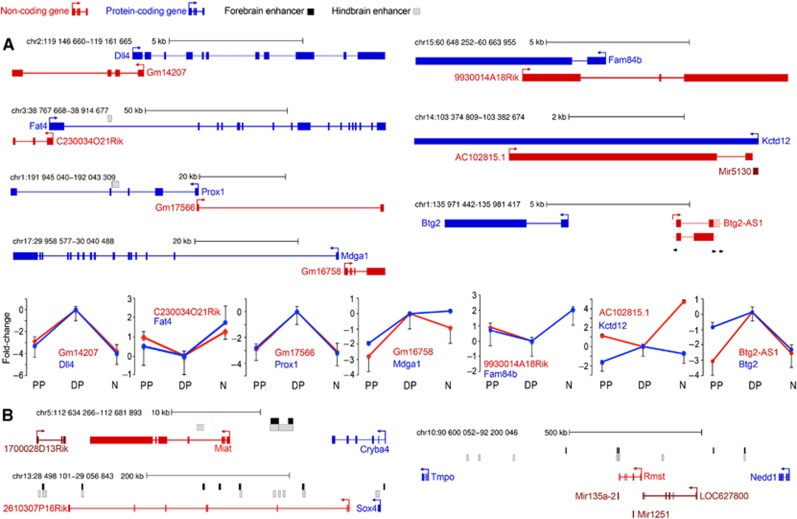
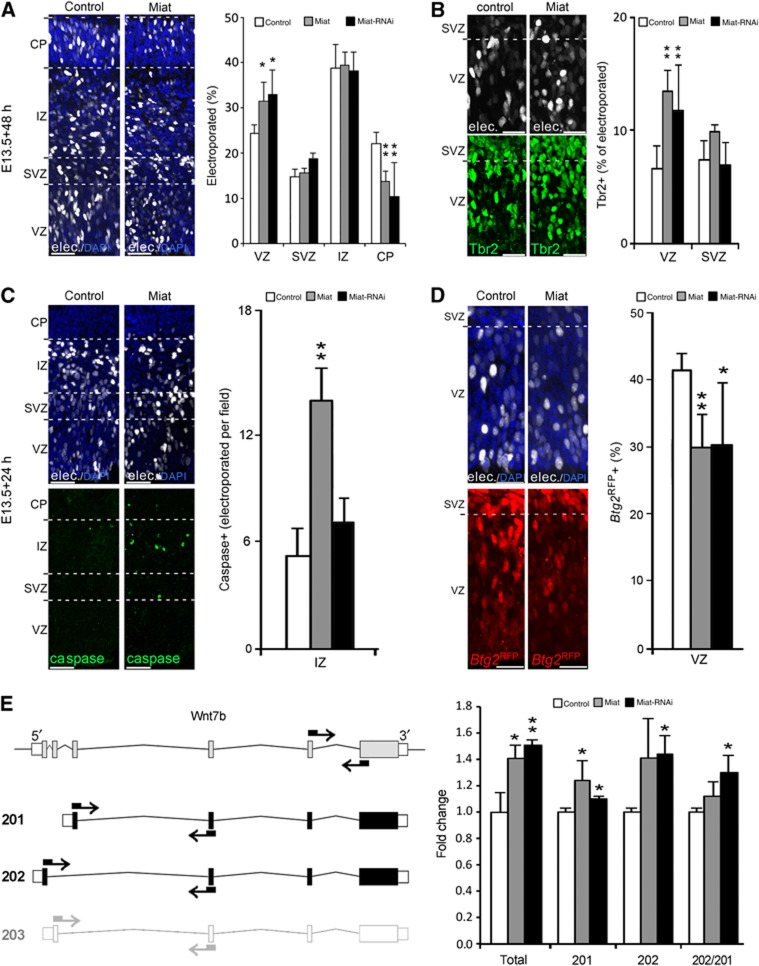
Transcriptome analysis of somatic stem cells and their progeny is fundamental to identify new factors controlling proliferation versus differentiation during tissue formation. Here, we generated a combinatorial, fluorescent reporter mouse line to isolate proliferating neural stem cells, differentiating progenitors and newborn neurons that coexist as intermingled cell populations during brain development. Transcriptome sequencing revealed numerous novel long non-coding (lnc)RNAs and uncharacterized protein-coding transcripts identifying the signature of neurogenic commitment. Importantly, most lncRNAs overlapped neurogenic genes and shared with them a nearly identical expression pattern suggesting that lncRNAs control corticogenesis by tuning the expression of nearby cell fate determinants. We assessed the power of our approach by manipulating lncRNAs and protein-coding transcripts with no function in corticogenesis reported to date. This led to several evident phenotypes in neurogenic commitment and neuronal survival, indicating that our study provides a remarkably high number of uncharacterized transcripts with hitherto unsuspected roles in brain development. Finally, we focussed on one lncRNA, Miat, whose manipulation was found to trigger pleiotropic effects on brain development and aberrant splicing of Wnt7b. Hence, our study suggests that lncRNA-mediated alternative splicing of cell fate determinants controls stem-cell commitment during neurogenesis.


Conflict of interest statement

The authors declare that they have no conflict of interest.

Figures

Figure 1
Figure 1
Generation of Btg2RFP and Btg2RFP/Tubb3GFP mouse lines. (A) Map (exons not in scale) of the Btg2 locus within a bacterial artificial chromosome (BAC) showing the insertion of a nuclear-localized (nls) RFP in the gene first exon. (B) Whole-mount pictures of E10.5-E13.5 Btg2RFP mice showing endogeneous RFP fluorescence. Note the gradients of RFP expression (arrowhead) along the forebrain. (C) Picture of a cryosection through the lateral cortex of an E14.5 Btg2RFP mouse embryo after in situ hybridization using RFP probes. (DD′) Fluorescence pictures of the E14.5 VZ/SVZ (D) and high-power view of a mitotic APs (D′; arrowhead) of a Btg2RFP/Btg2GFP embryo displaying (D=left to right; D′=top to bottom) single RFP or GFP fluorescence and their colocalization. (E) Whole-mount pictures of an E14.5 Btg2RFP/Tubb3GFP embryo showing individual and merged RFP, GFP and DIC channels. (F) Fluorescence picture of a cryosection through the lateral cortex of an E14.5 Btg2RFP/Tubb3GFP embryo. SC=spinal cord; Hb=hindbrain; Mb=midbrain; Tel=telecephalon; VZ=ventricular zone; SVZ=subventriculal zone; IZ=intermediate zone; CP=cortical plate. Dashed lines in (C), (D) and (F) indicate boundaries between cortical layers. Scale bars=1 mm (B, E), 20 μm (D, F) and 5 μm (D′).
Figure 2
Figure 2
Isolation and sequencing of progenitors. (A, left to right) Gating parameters (lines) used to sort single (P1) and individual, or combined, RFP/GFP fluorescent (red, green and yellow as merge) cells. Interspaces (int.) used as thresholds are indicated. (B) Total, mappable and unique reads (left axis) plus assayed genes (right axis) of RFP– (grey), RFP+ (red) and GFP+ (green) cells. (C) Sample to sample Pearson’s correlation (blue; top-right quadrants) and pairwise comparison (dotted boxes; bottom-left quadrants) of DESeq-normalized gene expression between three biological replicas (1–3) and cell types (colours). (D) Expression of established markers of undifferentiated neural stem cells (left), neurogenic progenitors (middle) and neurons (right). Normalized counts in cell types (colours) are represented on a logarithmic scale relative to the population of reference within each panel. By this, expression of markers of PPs, DPs and neurons is defined=1 in the left, middle and right panels, respectively. Bars=s.d.; *P<0.05; **P<0.005.
Figure 3
Figure 3
Differentially expressed genes. (A) Differential expression among RFP– and RFP+ (left) or RFP+ and GFP+ (right) cells. DESeq-normalized mean expression (x axis; log10 scale) and fold changes (y axis; log2 values) of differentially expressed (red) or unchanged (grey) genes (5% FDR) are indicated. Black dots indicate overlapping grey dots. (B) Representation of up- or down-regulation (lines pointing up or down, respectively) along the neurogenic lineage from PP to DPs and DPs to neurons (grey, red and green, respectively). The area of circles represents the number of transcripts detected in each population with number and proportion relative to the parental population (connecting lines) being indicated within each. Transcripts not expressed in RFP– or never detected in any population are also indicated (left; black and white, respectively). Horizontal lines include both not significantly changed transcripts and those changing <50%. (C, D) DAVID-functional annotation analysis of differentially expressed genes in RFP– versus RFP+ (C) or RFP+ versus GFP+ (D) cells. All (top), up- (middle) or down- (bottom) regulated transcripts were analysed separately and enrichment scores of the top 7 indicated (Supplementary File 2).
Figure 4
Figure 4
Switch genes identify the signature of DPs. (A, B) Heat maps representation of all on- (A) and off- (B) switch genes (left) and differential gene expression (y axis=log2 values) of 25 with the higher expression in RFP+ cells (right) (Supplementary File 4). Note in (A) the presence of several markers of neurogenic commitment. (C) DAVID-functional annotation and enrichment scores of the top five terms of all (left), on- (middle) and off- (right) switch genes. (D) Hierarchical cluster tree (left) and association (right) of modules Eigengene (rows) with cell types (columns) are indicated. Numbers correspond to correlation and P-value (brackets). Negative values represent down-regulation. Colours represent modules (grey, blue, brown, etc.) or their correlation value (green-to-red gradient) (Supplementary File 3). (E) Proportion of switch lncRNAs within each module. Asterisk in grey indicates a significant overrepresentation (P<0.05, hypergeometric distribution).
Figure 5
Figure 5
Switch lncRNAs loci of intergenic (A) and genic (B) lncRNAs (red), protein-coding genes (blue) and miRNAs (dark red) transcribed in sense or antisense (arrows) are depicted together with their pattern of expression in PPs, DPs and neurons (N) (B, bottom; log2-fold change relative to DPs). Intronic and exonic regions, genomic mapping and p300 fore-/hind-brain enhancers (black/grey boxes) are shown. Note two Btg2-AS1 variants (A, bottom, right) differing in a 3′ splice site usage (red/pink=validated by sequencing/as PCR band).
Figure 6
Figure 6
Switch genes influence corticogenesis Fluorescence pictures of cryosections through the E15.5 mouse cortex (top) and related diagrams of targeted cells (bottom) after 2 days overexpression of control or switch genes (as indicated). Targeted cells were identified by a coexpressed nuclear-fluorescent reporter (white; top) and outlined in the respective diagrams (circles; bottom). DAPI was used to label all nuclei (blue; top). Cortical layers are indicated (red lines; bottom). VZ=ventricular zone; SVZ=subventricular zone; IZ=intermediate zone; CP=cortical plate. All switch transcripts induced significant (P<0.05; n=3; Gm17566=2) changes in the proportion of electroporated cells in the CP relative to control. Scale bar=40 μm.
Figure 7
Figure 7
Miat influences corticogenesis and splicing. (AD) Fluorescence pictures of cryosections through the mouse cortex (left) and quantifications of cell types (right) after in utero electroporation at E13.5 with control (white), Miat overexpression (grey) or RNAi (black) vectors. Embryos were dissected 48 (A, B) or 24 (C, D) h later to quantify distribution of cells (A) (dashed lines), Tbr2 immunoreactivity (B), number of caspase-3+ cells per optical field (i.e., independently if electroporated or not) (C) or Btg2RFP endogeneous fluorescence (D). (E) Maps (left) of Wnt7b Ensembl annotated variants (201, 202 and 203) and quantification of expression (right) upon Miat manipulation. Primers used (arrows) are indicated (not in scale). Wnt7b-203 (left, light grey) was not significantly detected neither by sequencing nor by qRT-PCR. Graph represents fold changes (left to right) of total, Wnt7b variants and their proportion. VZ=ventricular zone; SVZ=subventricular zone; IZ=intermediate zone; CP=cortical plate. Error bars=s.d.; n⩾3 embryos; *P<0.05; **P<0.005. Scale bar=40 (A, C) or 20 (B, D) μm.

References

    1. Aaker JD, Patineau AL, Yang HJ, Ewart DT, Gong W, Li T, Nakagawa Y, McLoon SC, Koyano-Nakagawa N (2009) Feedback regulation of NEUROG2 activity by MTGR1 is required for progression of neurogenesis. Mol Cell Neurosci 42: 267–277 - PMC - PubMed
    1. Amaral PP, Clark MB, Gascoigne DK, Dinger ME, Mattick JS (2011) lncRNAdb: a reference database for long noncoding RNAs. Nucleic Acids Res 39: D146–D151 - PMC - PubMed
    1. Aprea J, Calegari F (2012) Bioelectric state and cell cycle control of Mammalian neural stem cells. Stem Cells Int 2012: 816049. - PMC - PubMed
    1. Arai Y, Funatsu N, Numayama-Tsuruta K, Nomura T, Nakamura S, Osumi N (2005) Role of Fabp7, a downstream gene of Pax6, in the maintenance of neuroepithelial cells during early embryonic development of the rat cortex. J Neurosci 25: 9752–9761 - PMC - PubMed
    1. Arai Y, Pulvers JN, Haffner C, Schilling B, Nusslein I, Calegari F, Huttner WB (2011) Neural stem and progenitor cells shorten S-phase on commitment to neuron production. Nat Commun 2: 154. - PMC - PubMed

Publication types

Associated data