. 2014 Jan;11(1):94-9.
doi: 10.1038/nmeth.2733. Epub 2013 Nov 17.

Integrating protein-protein interaction networks with phenotypes reveals signs of interactions

Affiliations

Integrating protein-protein interaction networks with phenotypes reveals signs of interactions

Arunachalam Vinayagam et al. Nat Methods. 2014 Jan.

Abstract

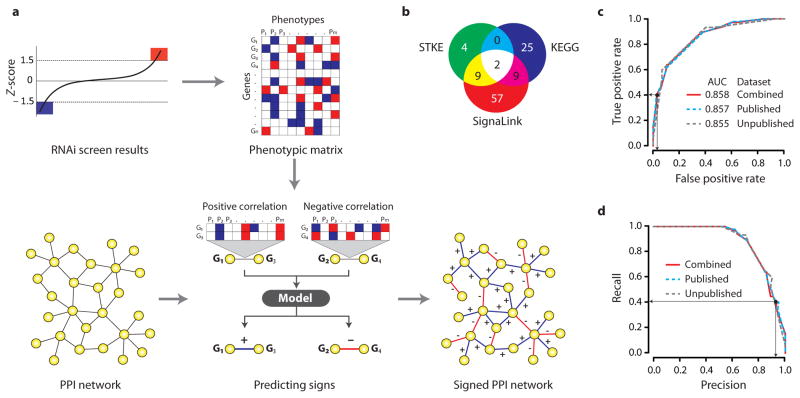
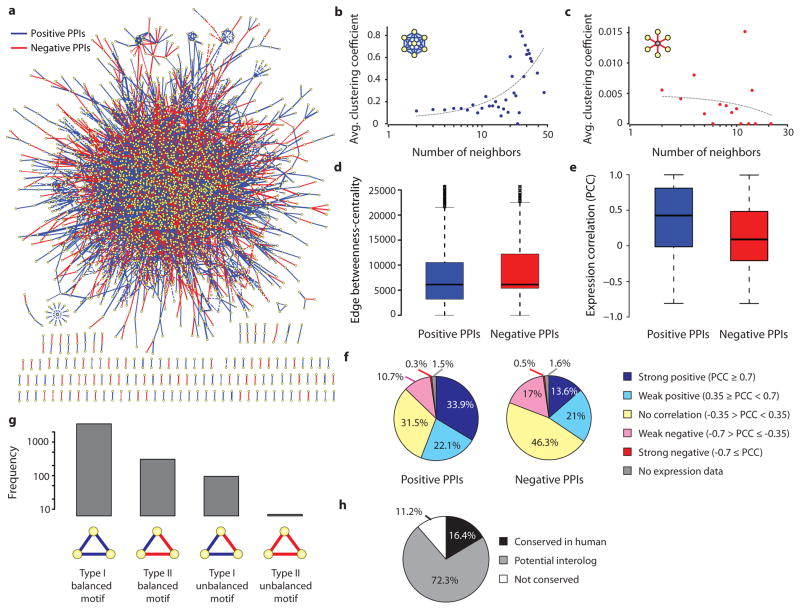
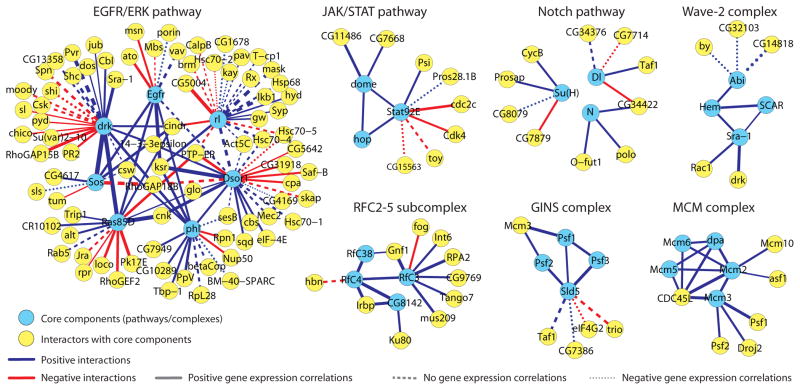
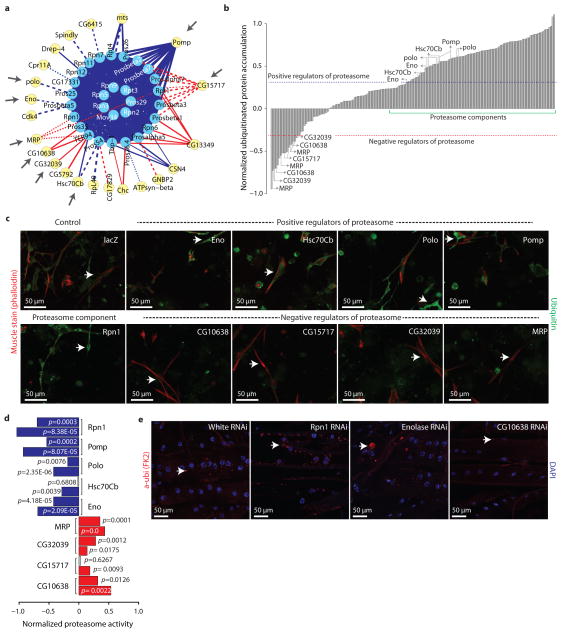
A major objective of systems biology is to organize molecular interactions as networks and to characterize information flow within networks. We describe a computational framework to integrate protein-protein interaction (PPI) networks and genetic screens to predict the 'signs' of interactions (i.e., activation-inhibition relationships). We constructed a Drosophila melanogaster signed PPI network consisting of 6,125 signed PPIs connecting 3,352 proteins that can be used to identify positive and negative regulators of signaling pathways and protein complexes. We identified an unexpected role for the metabolic enzymes enolase and aldo-keto reductase as positive and negative regulators of proteolysis, respectively. Characterization of the activation-inhibition relationships between physically interacting proteins within signaling pathways will affect our understanding of many biological functions, including signal transduction and mechanisms of disease.


Figures

Figure 1
Figure 1
Framework to predict the signs of protein interactions. (a) Schematic representation of the framework. (b) Sources of signaling PPIs with known edge signs. (c) ROC plot and (d) precision-recall curve shows the performance of the sign prediction model. Black dots and the arrows show the chosen Sscore cutoff (Sscore ≥ 1 or Sscore ≤ −1).
Figure 2
Figure 2
Drosophila signed PPI network properties. (a) Signed PPI network. (b–f) Comparison of positive and negative interactions with respect to average clustering coefficient (b, c), edge betweenness-centrality (d) and gene expression correlation (e). Grey dotted line in (b, c) corresponds to regression line. (f) Classification of positive and negative interactions with respect to the gene-expression correlation (Pearson correlation coefficient). (g) Frequency of triad motifs in the signed PPI network. (h) Conservation of signed interactions.
Figure 3
Figure 3
Network representation of signed PPIs connecting known signaling pathways and protein complexes (see methods).
Figure 4
Figure 4
Validation of predicted proteasome regulators. (a) Sub-network of proteasome complex (as in Figure 3). Grey arrows highlights subsequently validated proteins. (b) Results from the image-based RNAi screen measuring the accumulation of ubiquitinated proteins in primary muscle cells in which regulators shown in (a) has been knocked down with RNAi. Blue and red dotted-lines indicated the cut-off values used for positive and negative regulators, respectively. Green line highlights region corresponding to most proteasome core components. (c) Micrographs show muscle cells stained with phalloidin (red) and α-ubiquitin (green), in which the indicated candidate regulator has been knocked down with RNAi. Arrows point to ubiquitinated proteins in cells. (d) Enzymatic activity of the proteasome upon the indicated RNAi treatment in S2R+ cultured cells. Blue and red bars corresponds to significant reduction and increase in proteasome activity, respectively. Independent RNAi reagents are shown for each gene. (e) Micrographs show 3rd instar larval longitudinal muscles expressing the indicated RNAi hairpins under control of the muscle-specific driver line Dmef2-Gal4 (red=phalloidin, blue=DAPI). Arrows point to ubiquitin-labeled aggregates.

References

    1. Guruharsha KG, et al. A protein complex network of Drosophila melanogaster. Cell. 2011;147:690–703. - PMC - PubMed
    1. Gavin AC, et al. Proteome survey reveals modularity of the yeast cell machinery. Nature. 2006;440:631–636. - PubMed
    1. Krogan NJ, et al. Global landscape of protein complexes in the yeast Saccharomyces cerevisiae. Nature. 2006;440:637–643. - PubMed
    1. Stelzl U, et al. A human protein-protein interaction network: a resource for annotating the proteome. Cell. 2005;122:957–968. - PubMed
    1. Rual JF, et al. Towards a proteome-scale map of the human protein-protein interaction network. Nature. 2005;437:1173–1178. - PubMed

Publication types